
The Optimization Overview page provides a comprehensive view of your portfolio's performance over time. This powerful tool enables you to analyze and understand the impact of your budget allocation decisions, helping you make data-driven adjustments to maximize results in future periods.
Key Features
- Available immediately after portfolio creation.
- Serves as an audit tool to predict future outcomes.
- Allows you to decide whether to modify portfolio settings before starting optimization.
Accessing the History Page
- Navigate to the portfolio page.
- Click the "Overview" button in the top right corner.
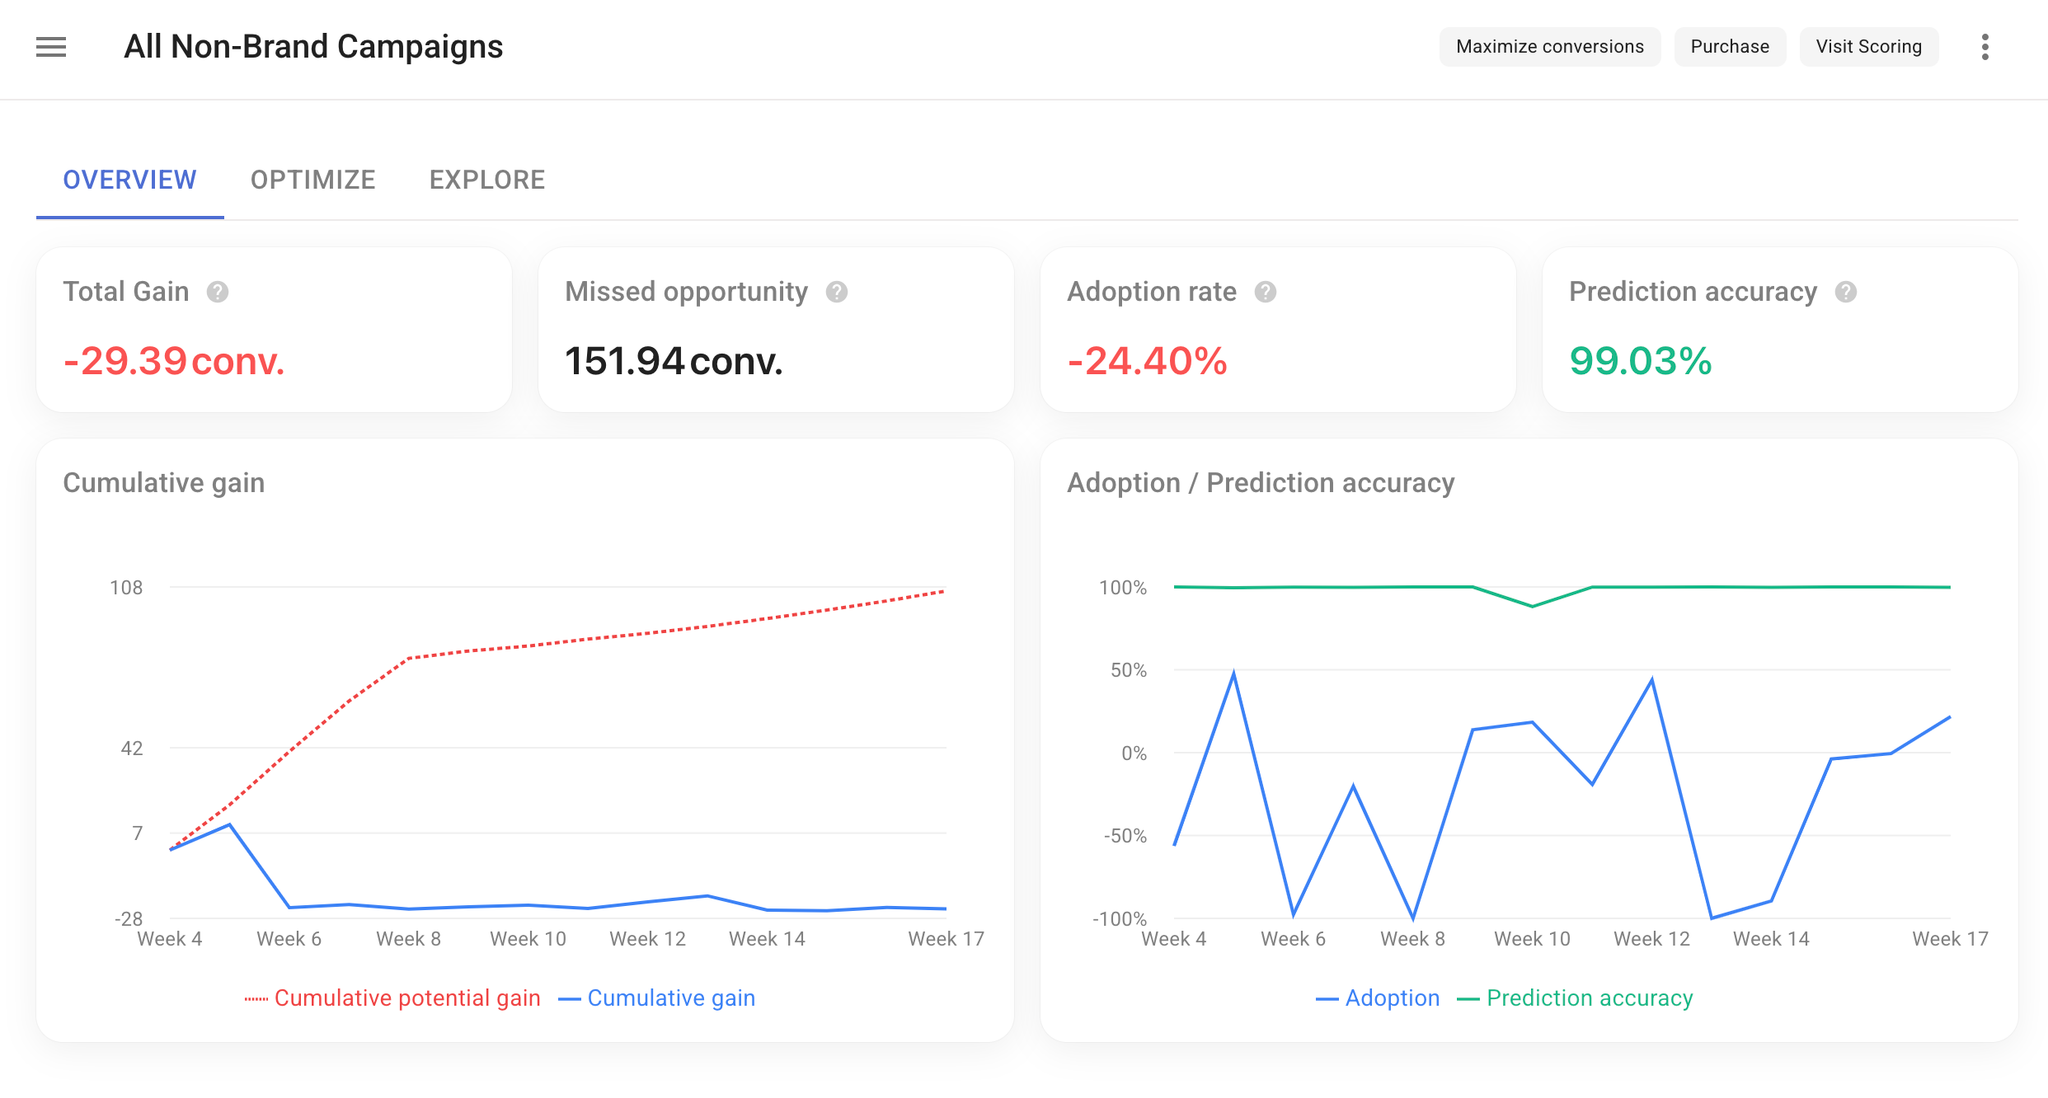
Overview
Summary Metrics
- Total Gain: Net results achieved through budget allocation changes.
- Missed Opportunity: Potential results lost due to not fully following recommendations.
- Adoption Rate: Percentage indicating adherence to recommended budget distribution.
- Prediction Accuracy: Accuracy of system recommendations based on previous data.
Visual Analysis
- Cumulative Gain Chart: Displays cumulative gain and potential gain over the selected period.
- Adoption Chart: Shows adoption rate and prediction accuracy over time.
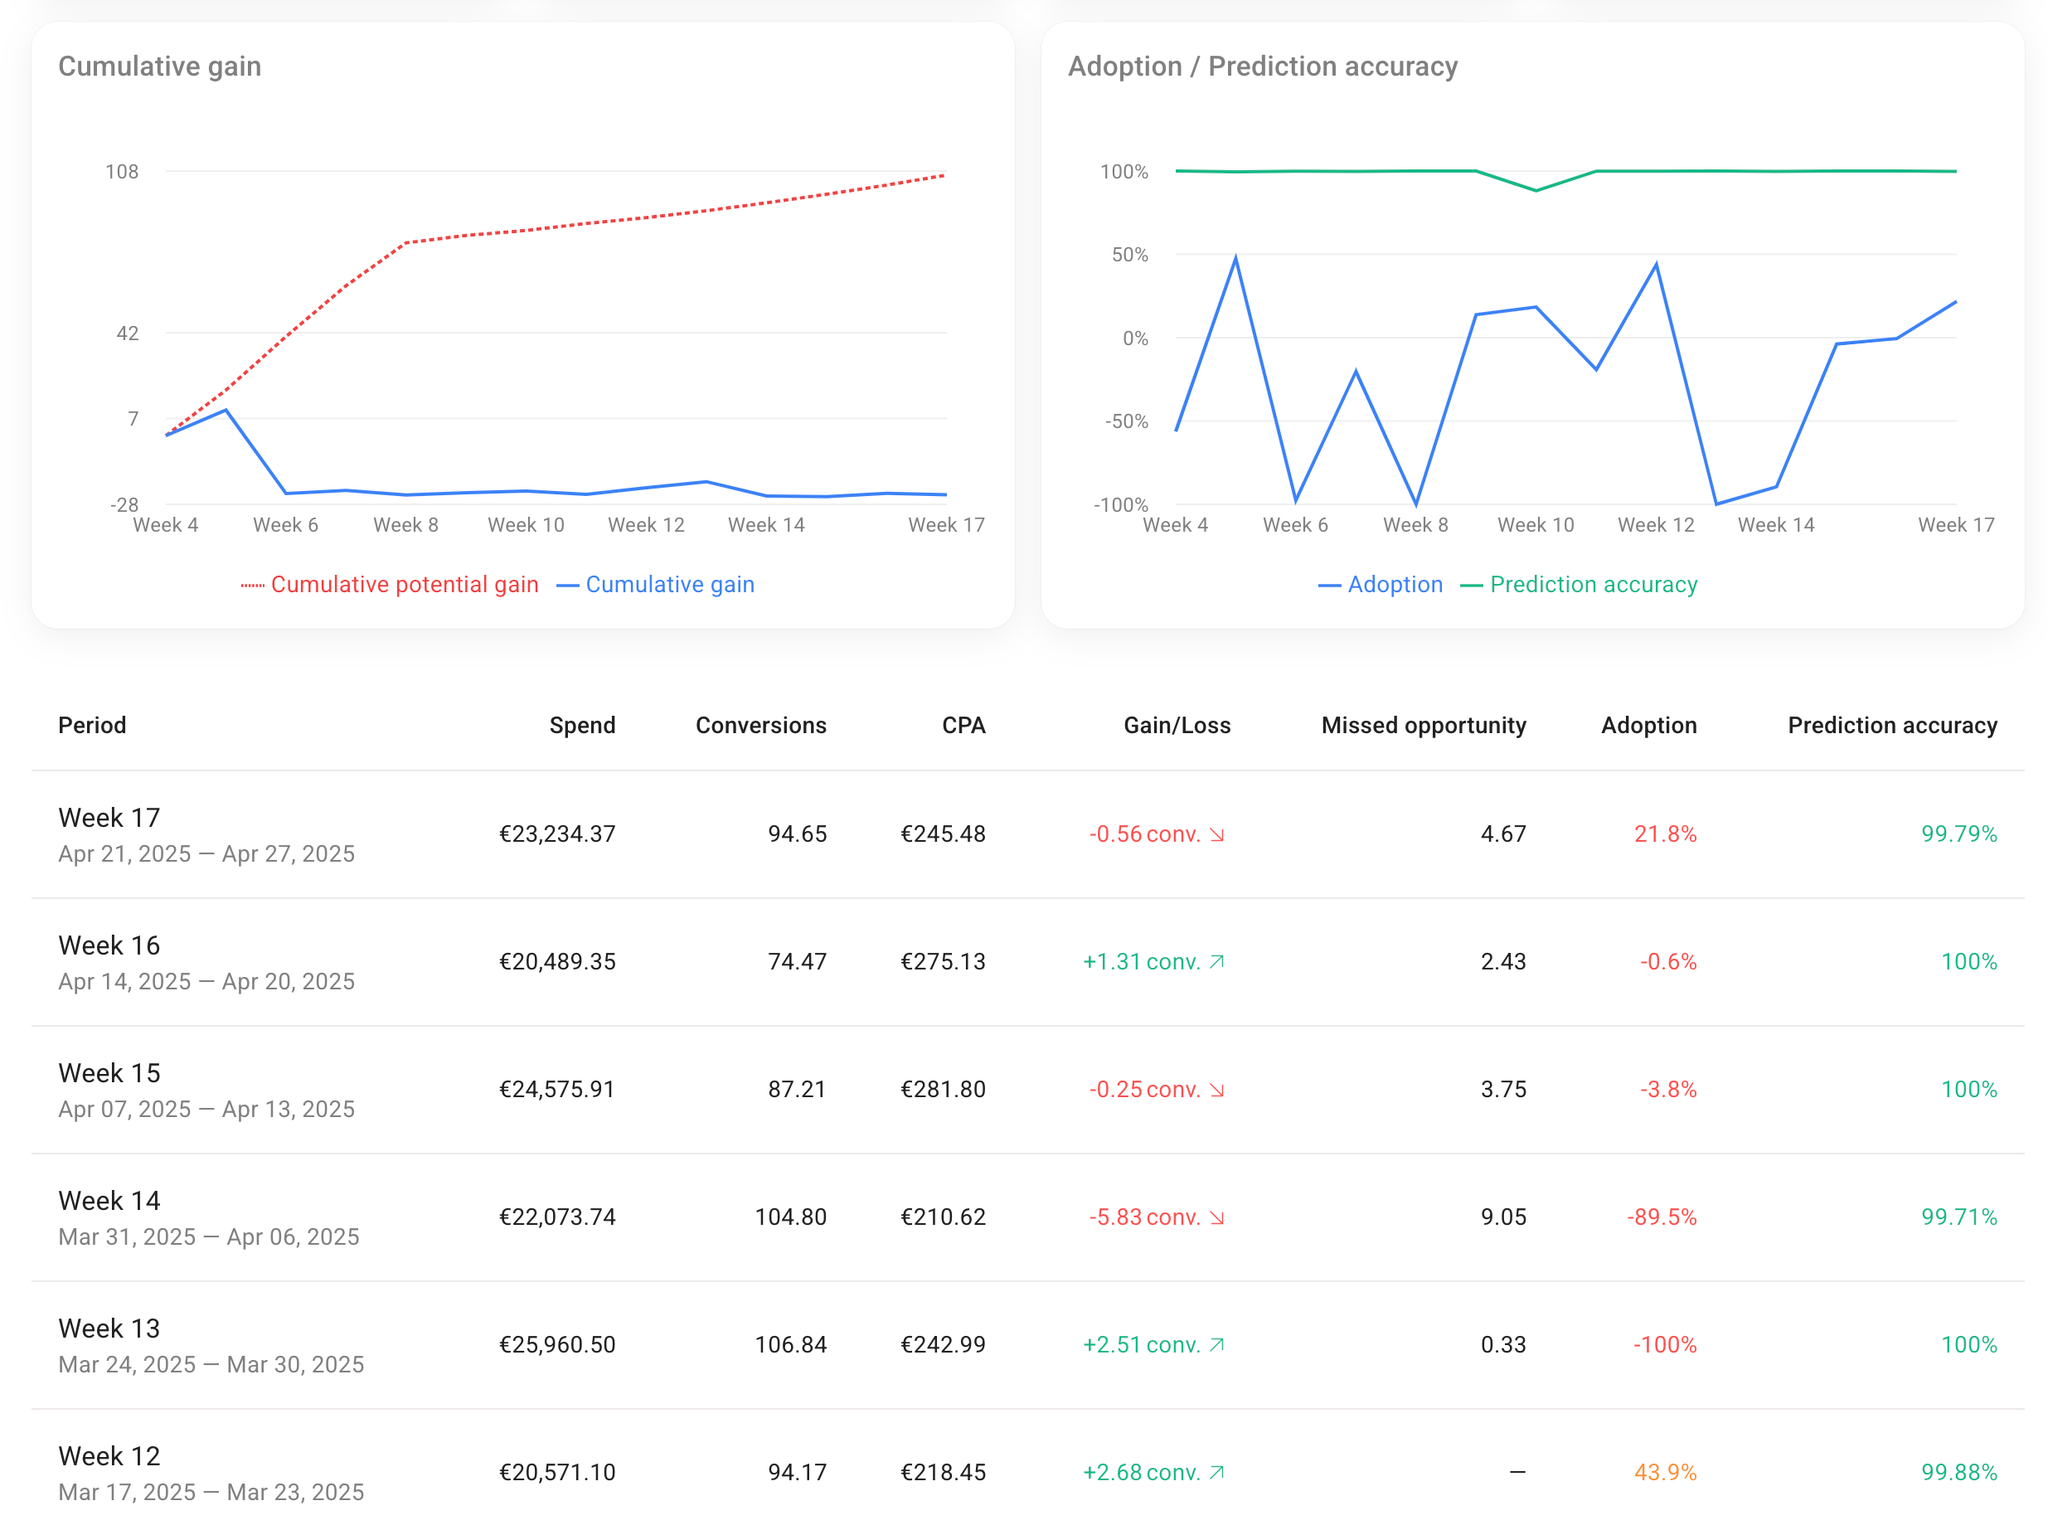
Detailed Period Analysis
For each period, the following metrics are provided:
- Spend
- Revenue or Conversions
- ROAS or CPA
- Gain/Loss
- Missed Opportunity
- Adoption
- Prediction Accuracy
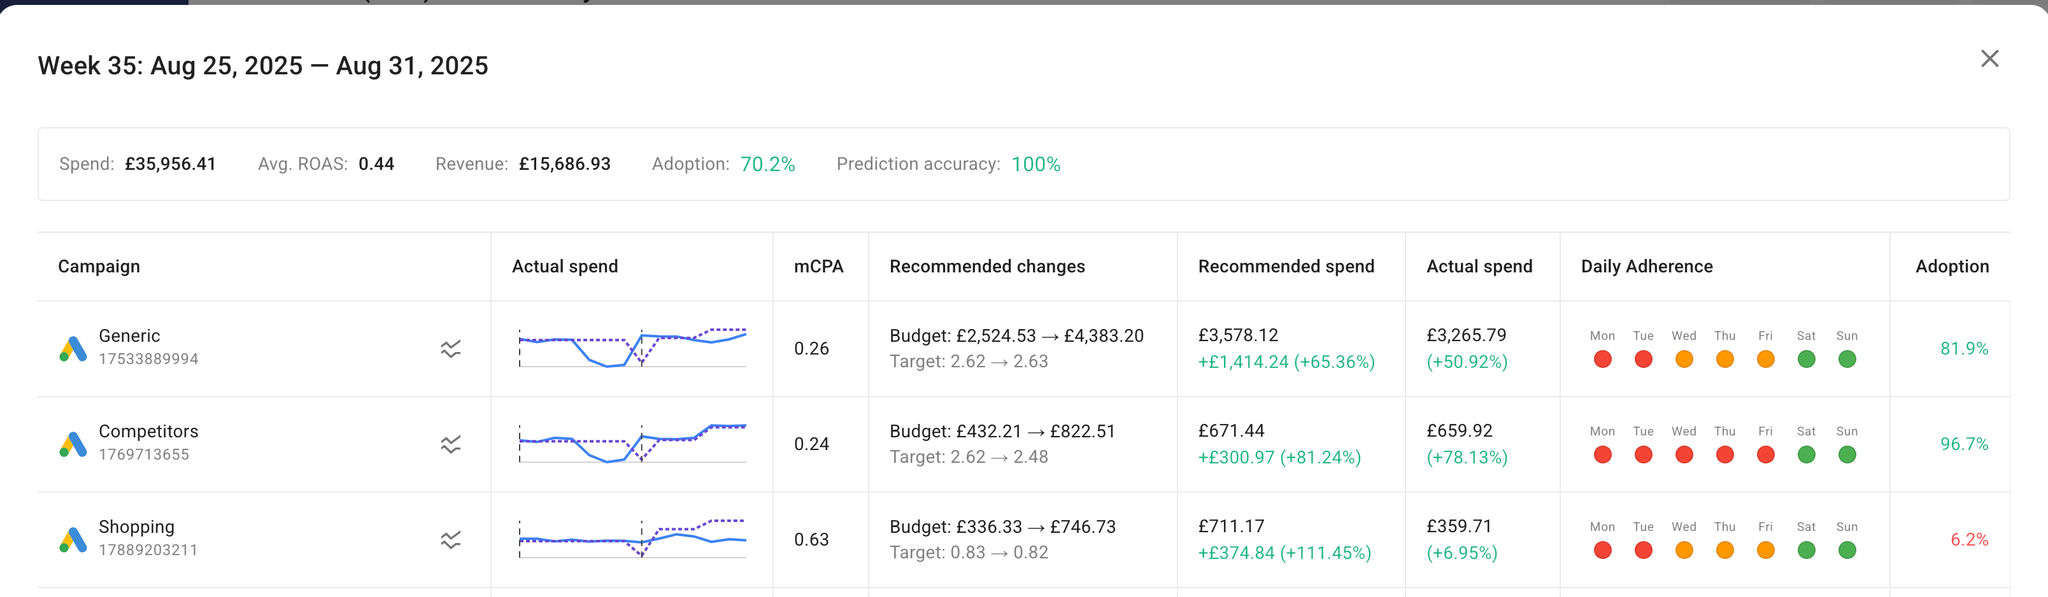
Portfolio Breakdown
When you select a specific period, you’ll see a detailed breakdown of each component:
- Actual Spend: A chart showing two lines — the recommended spend and the actual spend. Hover over the chart to view daily values for both.
- mROAS / mCPA: Depending on the portfolio settings, this will display either marginal Return on Ad Spend (mROAS) or marginal Cost per Action (mCPA).
- Recommended Changes: Suggested adjustments (budget & tROAS) that the portfolio recommends applying to the ad platform in order to reach the recommended spend.
- Recommended Spend: The suggested spend for the period, including the difference compared to the previous period.
- Actual Spend: The actual spend for the period, including the difference compared to the previous period.
- Daily Adherence: Indicates how closely the campaign settings in the ad platform (budget & tROAS) align with the portfolio’s recommended changes. (currently only available for Google Ads)
- Adoption: Shows how closely the recommended budget spend allocations are being followed.
Understanding Adoption Calculation
Adoption shows how closely your actual budget allocation follows our recommendations.
The Basics
We compare three budget distributions:
- Previous: How you spent your budget in the last period.
- Recommended: How we suggested you allocate your budget for this period.
- Actual: How you actually spent your budget in this period.
The Concept
Think of it as a scale between Previous and Recommended:
- If your actual allocation matches the Recommended, adoption = 100%.
- If your actual allocation stays the same as Previous, adoption = 0%.
- If your actual allocation falls between the two, adoption is somewhere between 0% and 100%.
For example:
- In the previous period, you spent 100.
- We recommended you spend 150.
- You actually spent 125.
Since 125 is halfway between 100 and 150, the adoption score = 50%.
The Calculation
We measure the angles between these arrows:
- The closer your actual spending is to our recommendation, the higher the adoption percentage.
- The closer your actual spending is to your previous spending, the lower the adoption percentage.
Understanding Prediction Accuracy Calculation
Prediction Accuracy measures how well our system predicts future campaign performance. Here's a simplified explanation of how we calculate it:
The Process
- Make Predictions: We predict how each campaign will perform in the future and recommend budget changes based on these predictions.
- Wait and See: After the period ends, we look at how campaigns actually performed.
- Calculate Best and Worst Scenarios: Using the actual performance data:
- We calculate the best possible outcome if we had perfect knowledge of the future.
- We also calculate the worst possible outcome.
- Measure Our Prediction: We see where our initial prediction falls between the best and worst scenarios.
The Calculation
- If our prediction is very close to the best scenario, Prediction Accuracy is close to 100%.
- If our prediction is closer to the worst scenario, Prediction Accuracy is closer to 0%.
An Example
Imagine we have three campaigns: A, B, and C.
- We predict their performance will be: B > A > C
- In reality, their performance was: A > B > C
Our prediction wasn't perfect (we got A and B switched), but it wasn't terrible either (C was correctly predicted as the lowest performer).
In this case, our Prediction Accuracy would be somewhere between 0% and 100%, depending on how big the difference was between A and B's performance.
Key Points
- Prediction Accuracy is about the order of performance, not exact numbers.
- It's measured against the best and worst possible scenarios based on actual data.
- 100% accuracy means we predicted the relative performance of all campaigns perfectly.
- 0% accuracy would mean our predictions were completely opposite to reality.
Remember, this is a simplified explanation. The actual calculation involves more complex mathematical computations to precisely measure these relationships.
Understanding GAIN/LOSS, Potential GAIN, and Missed Opportunity Calculations
GAIN/LOSS Calculation
GAIN/LOSS measures the impact of your budget redistribution decisions compared to making no changes.
- We compare two scenarios: a) Actual Result: The conversions or revenue achieved with your actual budget distribution. b) "No Action" Result: The theoretical conversions or revenue if you had kept the previous period's budget distribution.
- Calculation: GAIN/LOSS = Actual Result - "No Action" Result
- Interpretation:
- Positive value: You achieved a GAIN due to your actions.
- Negative value: You incurred a LOSS due to suboptimal or non-optimal actions.
Potential GAIN Calculation
Potential GAIN shows what could have been achieved if you had fully followed our recommendations.
- We compare two scenarios: a) Recommended Result: The theoretical conversions or revenue if you had followed our recommended budget distribution (100% adoption). b) "No Action" Result: Same as in the GAIN/LOSS calculation.
- Calculation: Potential GAIN/LOSS = Recommended Result - "No Action" Result
- Interpretation:
- This value shows the maximum potential improvement from following our recommendations.
Missed Opportunity Calculation
Missed Opportunity quantifies the difference between what you could have achieved and what you actually achieved.
Calculation: Missed Opportunity = Potential GAIN/LOSS - Actual GAIN/LOSS
Interpretation:
- This value represents the additional gain you could have realized by fully following our recommendations.
- A larger Missed Opportunity suggests that there's room for improvement in your budget allocation strategy.
Key Points
- All calculations use actual performance data applied to different budget distributions.
- These metrics help you understand the impact of your decisions and the potential for improvement.
- A positive GAIN/LOSS indicates effective budget reallocation.
- A large Missed Opportunity suggests you could benefit from following recommendations more closely.
Remember, these calculations provide insights to guide your future budget allocation decisions and help you maximize your marketing performance.
Important Considerations
To ensure accurate and meaningful analysis, our system focuses on campaigns with complete data while still representing all campaign activity. Here's what you need to know:
- Calculation Basis:
- Metrics such as Gain/Loss, Missed Opportunity, Adoption, and Prediction Accuracy are calculated only for campaigns or channels with consistent spending data in both the previous and current periods.
- Representation of Campaign Changes:
- The system shows trendlines to visualize why there might not be enough data in the previous or current periods for certain campaigns.
- These trendlines reflect past decisions made by users, such as starting new campaigns or stopping existing ones.
- For example, you might see a trendline that drops to zero, indicating a campaign that was stopped, or a line that starts midway through the period, representing a newly launched campaign.
- Incomplete Data Handling:
- Campaigns with incomplete data (e.g., no spending for at least the previous period or the current period) are still included in the detailed breakdown charts.
- This allows you to see the full picture of all campaign activity, even if some campaigns don't have enough data for certain calculations.
- Impact on Metrics Calculations:
- All campaigns, including those with incomplete data, are included in standard metrics calculations such as total Spend and total Conversions.
- However, campaigns with incomplete data do not participate in the calculations for Adoption, Gain, and other optimization-specific metrics that require consistent data across periods.
By presenting all campaign data while focusing optimization calculations on campaigns with consistent spending, we aim to provide you with both comprehensive activity overviews and reliable optimization insights. This allows you to make informed decisions based on historical performance while understanding the full scope of your marketing efforts.
Conclusion
The Optimization Overview page is a valuable tool for understanding your portfolio's performance over time. By regularly reviewing this data and considering the important factors discussed above, you can make informed decisions to optimize your marketing strategies and improve your overall results.