Key features
- Available immediately after portfolio creation.
- Serves as an audit tool to predict future outcomes.
- Allows you to decide whether to modify portfolio settings before starting optimization.
Accessing the overview page
- Navigate to the portfolio page.
- Click the Overview button in the top right corner.
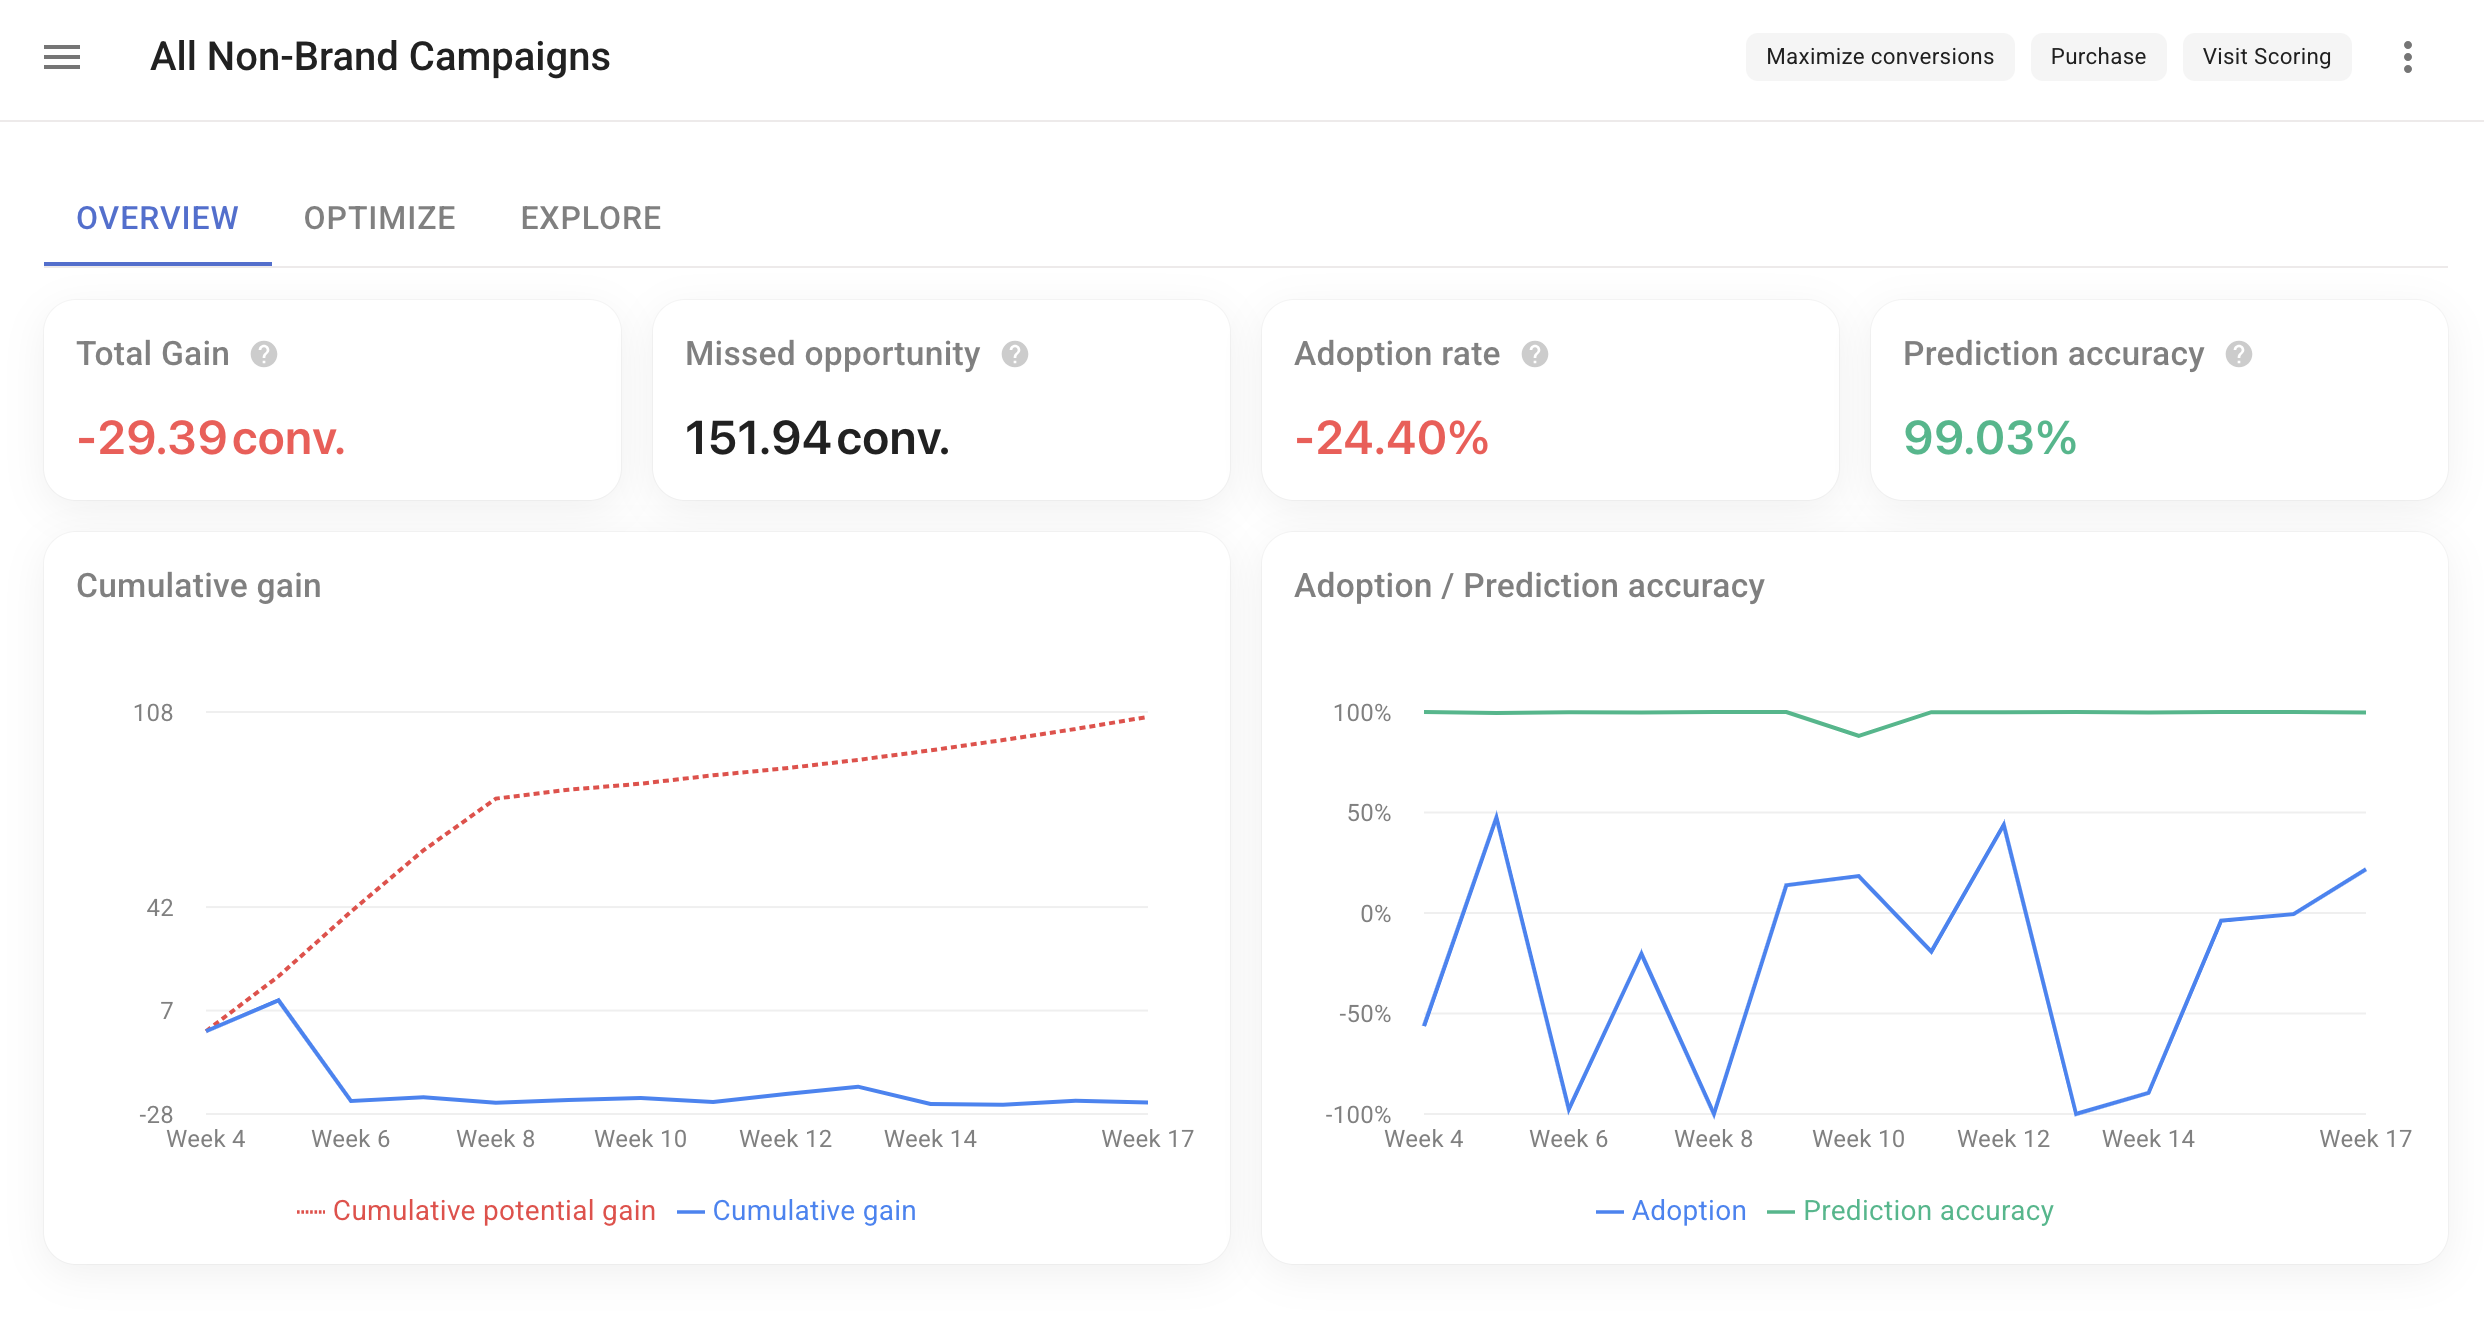
Summary metrics
- Total Gain — Net results achieved through budget allocation changes.
- Missed Opportunity — Potential results lost due to not fully following recommendations.
- Adoption Rate — Percentage indicating adherence to recommended budget distribution.
- Prediction Accuracy — Accuracy of system recommendations based on previous data.
Visual analysis
- Cumulative Gain Chart — Displays cumulative gain and potential gain over the selected period.
- Adoption Chart — Shows adoption rate and prediction accuracy over time.
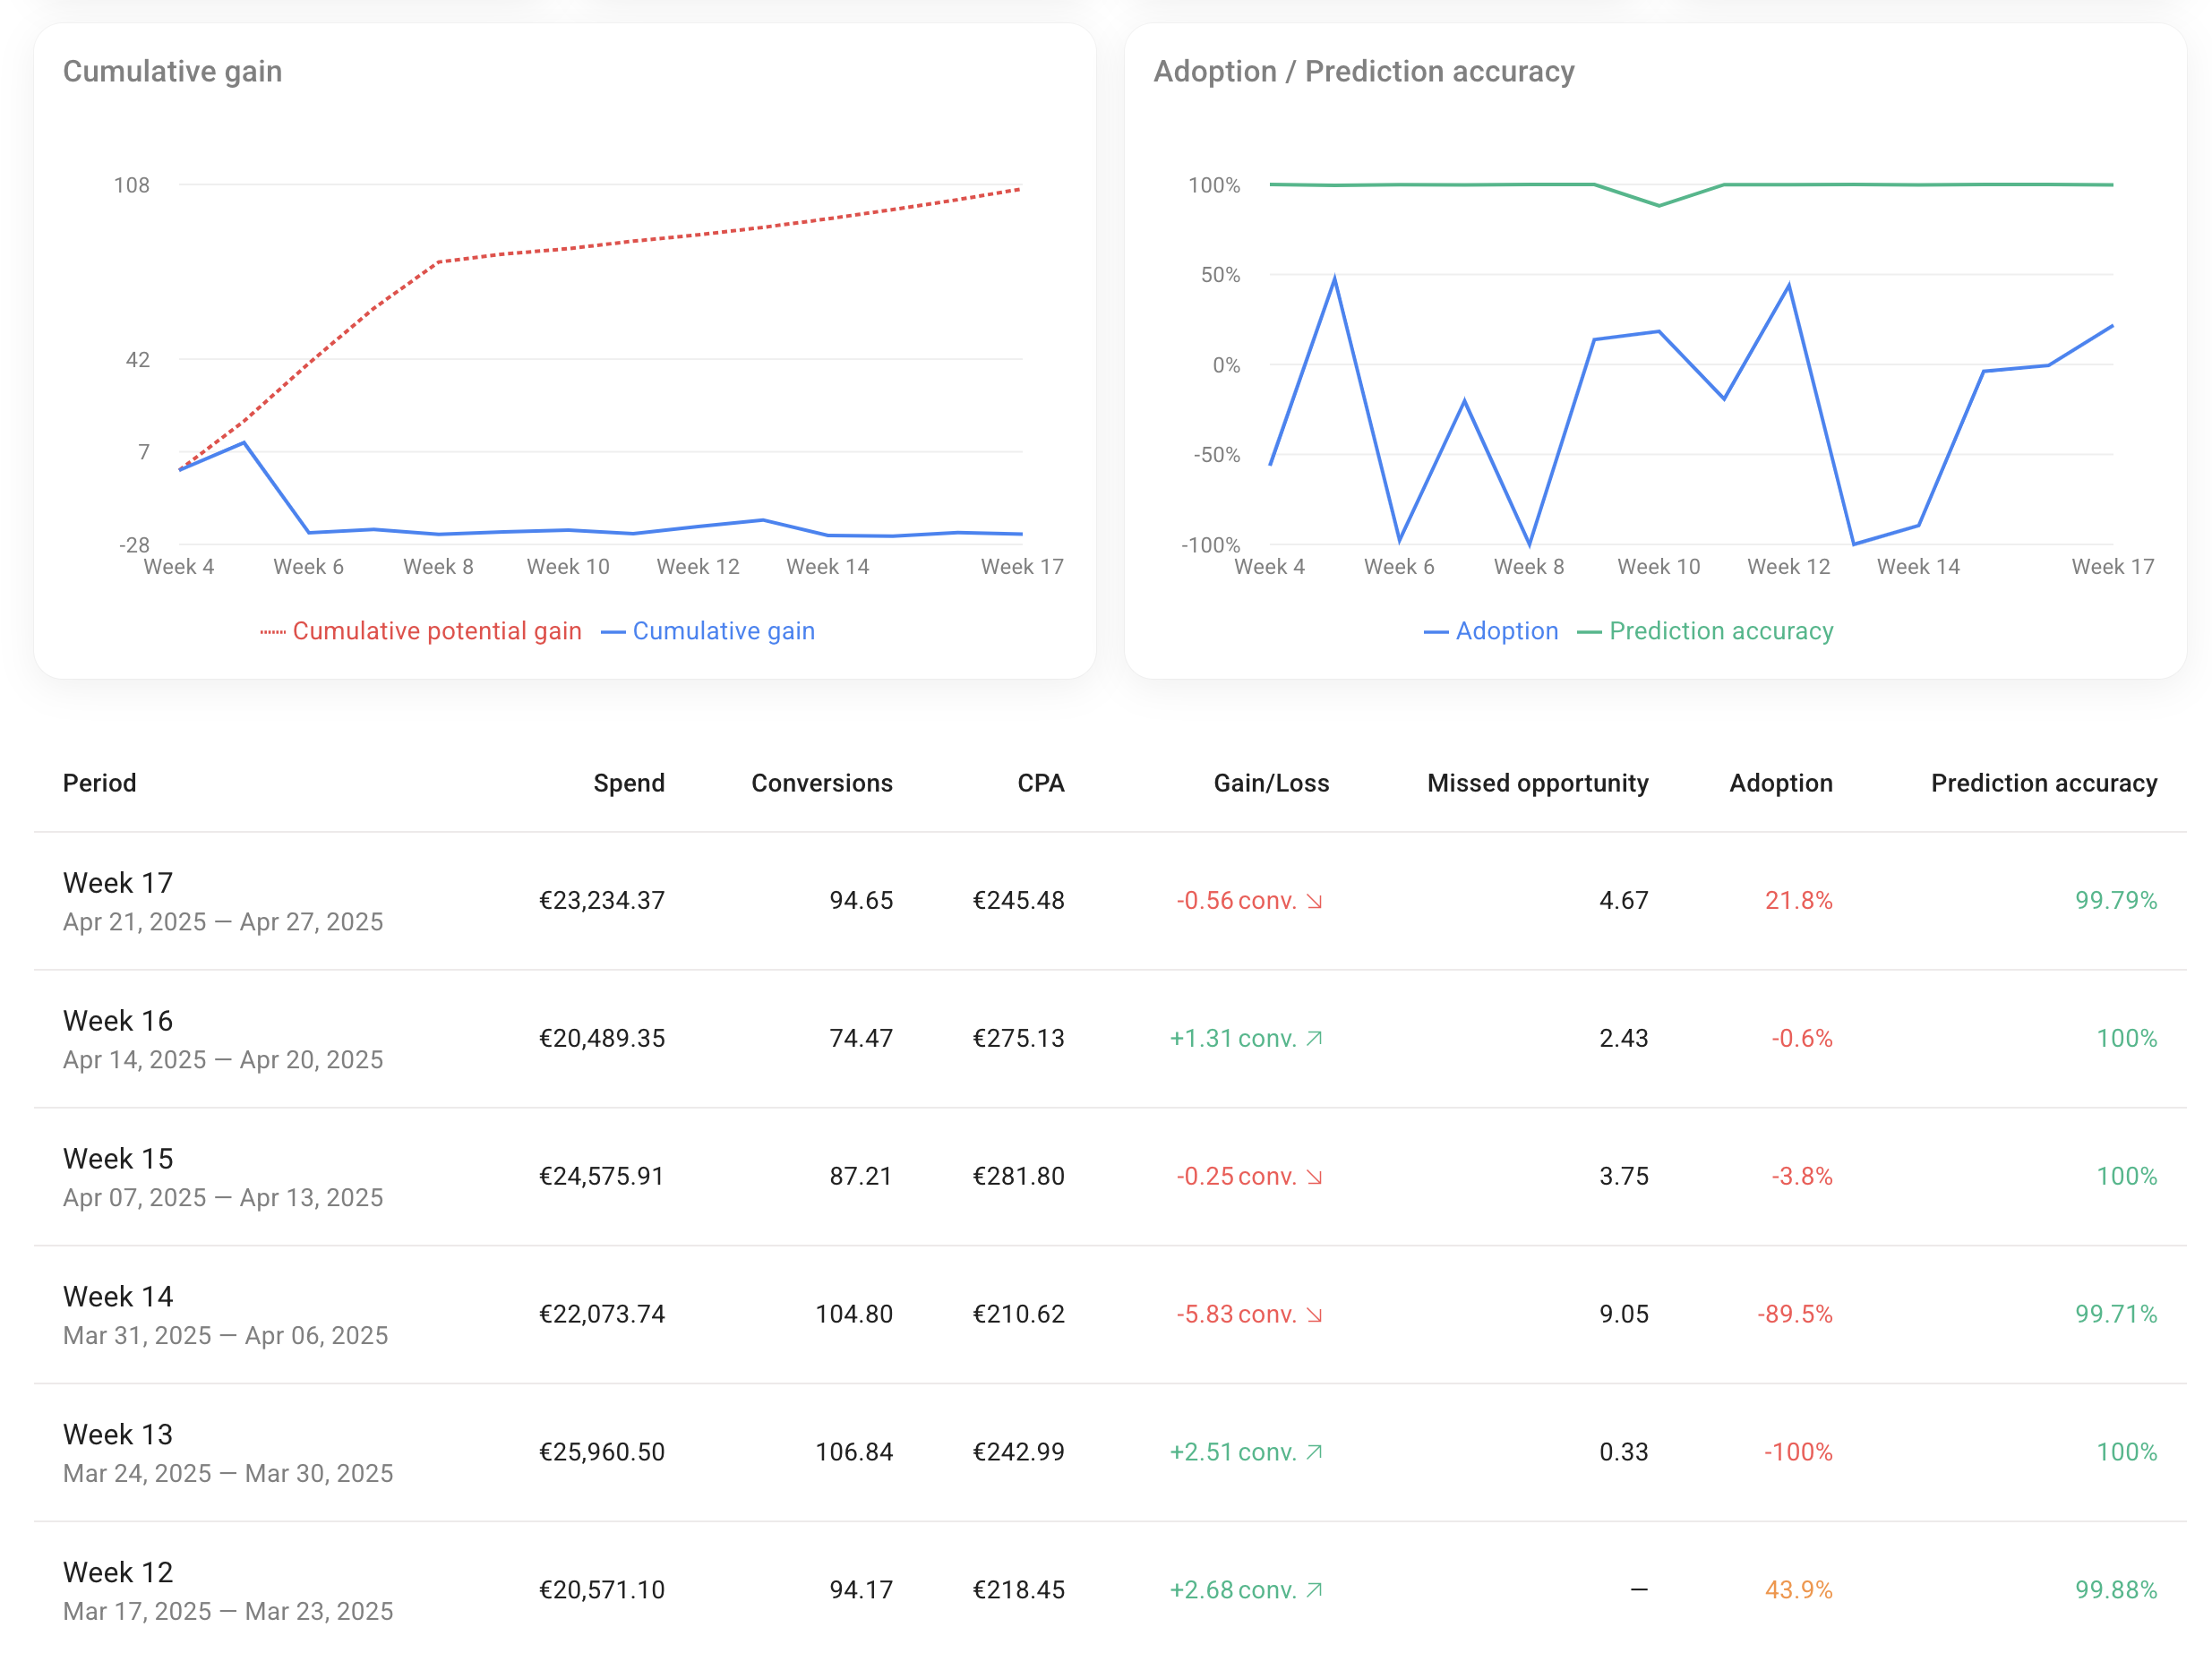
Detailed period analysis
For each period, the following metrics are provided:- Spend
- Revenue or Conversions
- ROAS or CPA
- Gain/Loss
- Missed Opportunity
- Adoption
- Prediction Accuracy
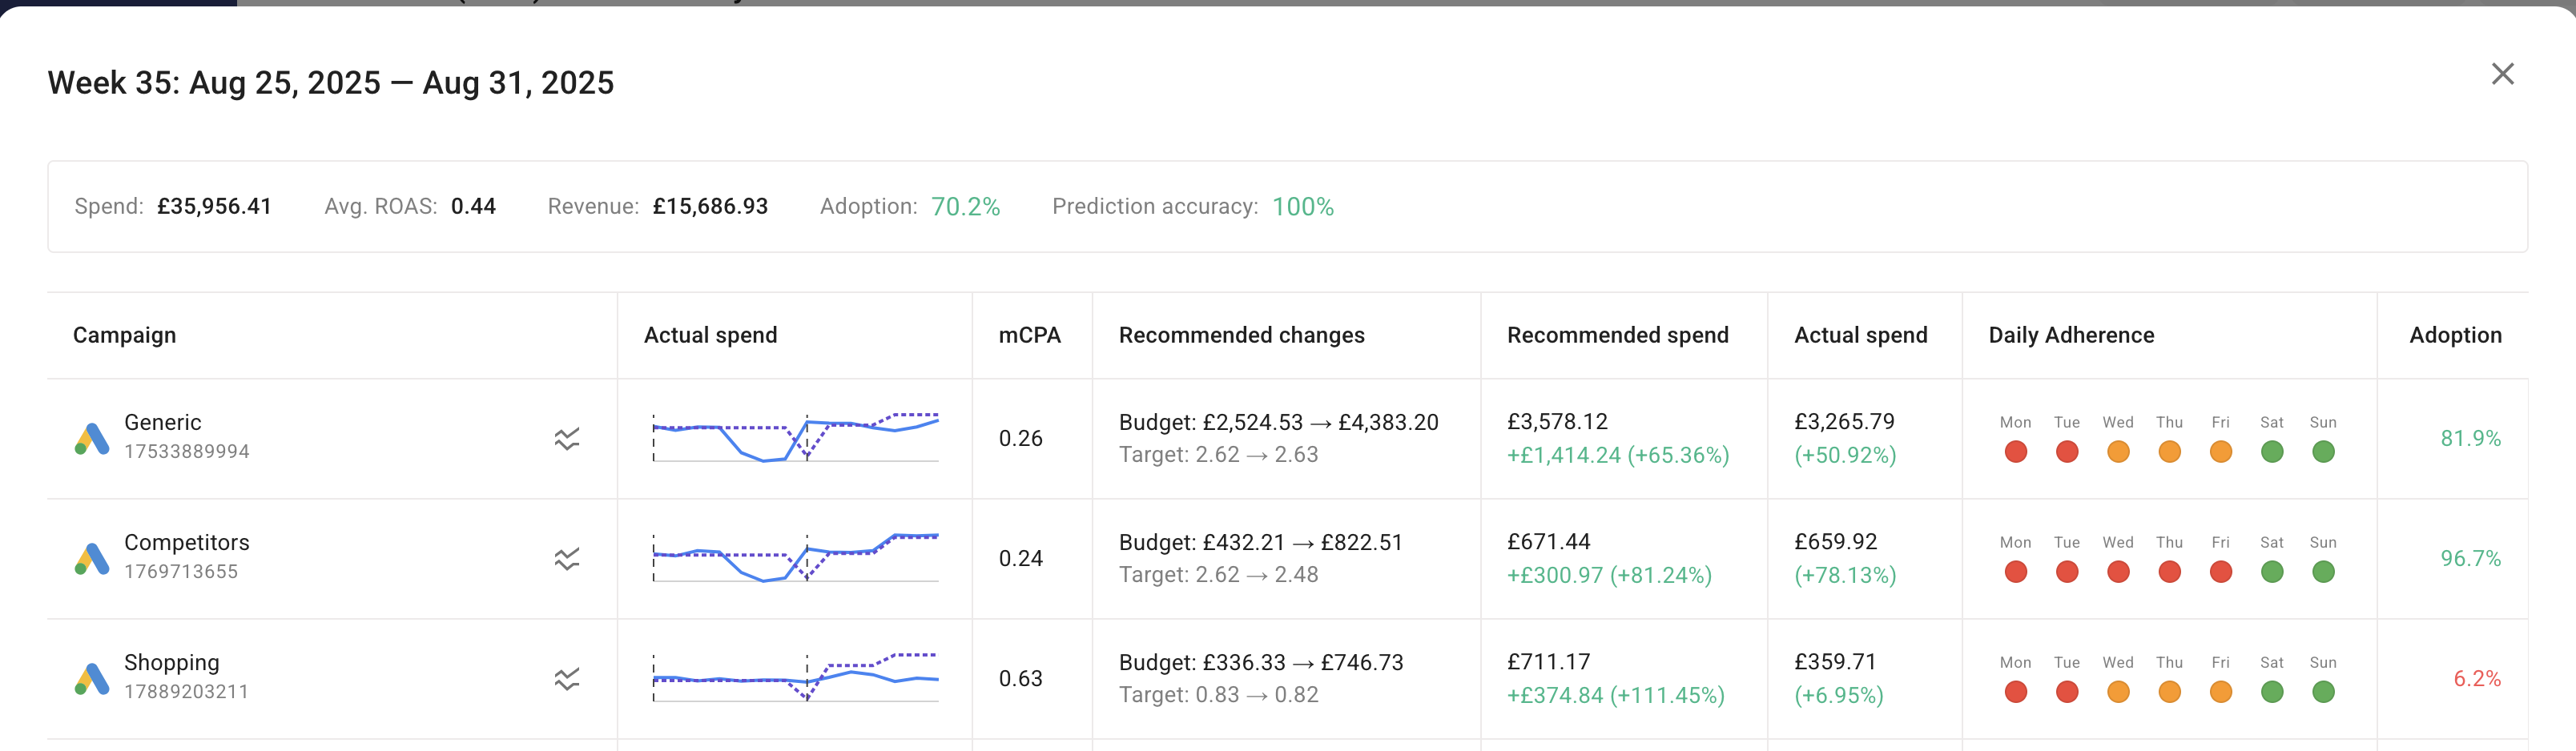
Portfolio breakdown
When you select a specific period, you see a detailed breakdown of each component:- Actual Spend — A chart showing two lines (recommended spend and actual spend). Hover over the chart to view daily values.
- mROAS / mCPA — Marginal Return on Ad Spend or marginal Cost per Action, depending on the portfolio settings.
- Recommended Changes — Suggested adjustments (budget and tROAS) to reach the recommended spend.
- Recommended Spend — The suggested spend for the period, including the difference compared to the previous period.
- Actual Spend — The actual spend for the period, including the difference compared to the previous period.
- Daily Adherence — How closely the campaign settings in the ad platform align with the portfolio’s recommended changes (currently only available for Google Ads).
- Adoption — How closely the recommended budget spend allocations are being followed.
Understanding adoption
Adoption shows how closely your actual budget allocation follows the recommendations.The basics
Three budget distributions are compared:- Previous — How you spent your budget in the last period.
- Recommended — How the system suggested you allocate your budget for this period.
- Actual — How you actually spent your budget in this period.
How it works
Think of it as a scale between Previous and Recommended:- If your actual allocation matches the Recommended, adoption = 100%.
- If your actual allocation stays the same as Previous, adoption = 0%.
- If your actual allocation falls between the two, adoption is somewhere between 0% and 100%.
Understanding prediction accuracy
Prediction Accuracy measures how well the system predicts future campaign performance.The process
- Make predictions — The system predicts how each campaign will perform and recommends budget changes.
- Wait and observe — After the period ends, actual performance is evaluated.
- Calculate best and worst scenarios — Using actual performance data, the best possible outcome (perfect knowledge) and worst possible outcome are calculated.
- Measure the prediction — The initial prediction is placed between the best and worst scenarios.
Interpretation
- If the prediction is close to the best scenario, Prediction Accuracy is close to 100%.
- If the prediction is closer to the worst scenario, Prediction Accuracy is closer to 0%.
Understanding gain/loss, potential gain, and missed opportunity
Gain/loss
Gain/loss measures the impact of your budget redistribution decisions compared to making no changes. Two scenarios are compared:- Actual Result — Conversions or revenue achieved with your actual budget distribution.
- No Action Result — Theoretical conversions or revenue if you had kept the previous period’s distribution.
- Positive value = gain due to your actions.
- Negative value = loss due to suboptimal actions.
Potential gain
Potential gain shows what could have been achieved with full adoption of recommendations. Two scenarios are compared:- Recommended Result — Theoretical conversions or revenue at 100% adoption.
- No Action Result — Same as above.
Missed opportunity
Missed opportunity quantifies the gap between potential and actual performance. Calculation: Missed Opportunity = Potential Gain - Actual Gain/Loss A larger missed opportunity suggests room for improvement in your budget allocation strategy.Important considerations
- Calculation basis — Metrics such as Gain/Loss, Missed Opportunity, Adoption, and Prediction Accuracy are calculated only for campaigns or channels with consistent spending data in both the previous and current periods.
- Representation of campaign changes — Trendlines visualize why data may be incomplete for certain campaigns in the previous or current periods, reflecting decisions such as starting new campaigns or stopping existing ones.
- Incomplete data handling — Campaigns with incomplete data are still included in the detailed breakdown charts, allowing you to see the full picture of all campaign activity.
- Impact on metrics — All campaigns are included in standard metrics (total Spend, total Conversions), but campaigns with incomplete data do not participate in Adoption, Gain, and other optimization-specific metric calculations.