> ## Documentation Index
> Fetch the complete documentation index at: https://docs.segmentstream.com/llms.txt
> Use this file to discover all available pages before exploring further.
# Geo Tests
> Conduct geo-incrementality experiments to measure the real sales impact of your paid media investments using controlled test and control markets.
SegmentStream's Geo Tests module allows you to conduct experiments that measure the real sales impact of your paid media investments.
By comparing the performance of a control market (where marketing activity remains unchanged) with a test market (where marketing activities are modified), you can directly observe the impact of these changes.
Currently, SegmentStream supports one type of treatment -- **holdout** -- where campaigns in the test market are completely disabled during the experiment. This allows you to evaluate their incrementality by observing the drop in conversions compared to the control market.
## Getting started
Before using the Geo Tests module:
* Set up [event tracking](/project-configuration/events-tracking).
* Connect at least one [data source](/project-configuration/data-sources/overview).
* Define at least one [conversion](/project-configuration/conversions).
* Ensure you have at least two months of conversion data.
## Navigation
You can find the Geo Tests module in the left menu.
## Setting up an experiment
Name the experiment, select the conversion and campaigns that will be used to measure incrementality, and choose an estimated experiment start date. All settings except for the conversion can be changed later.
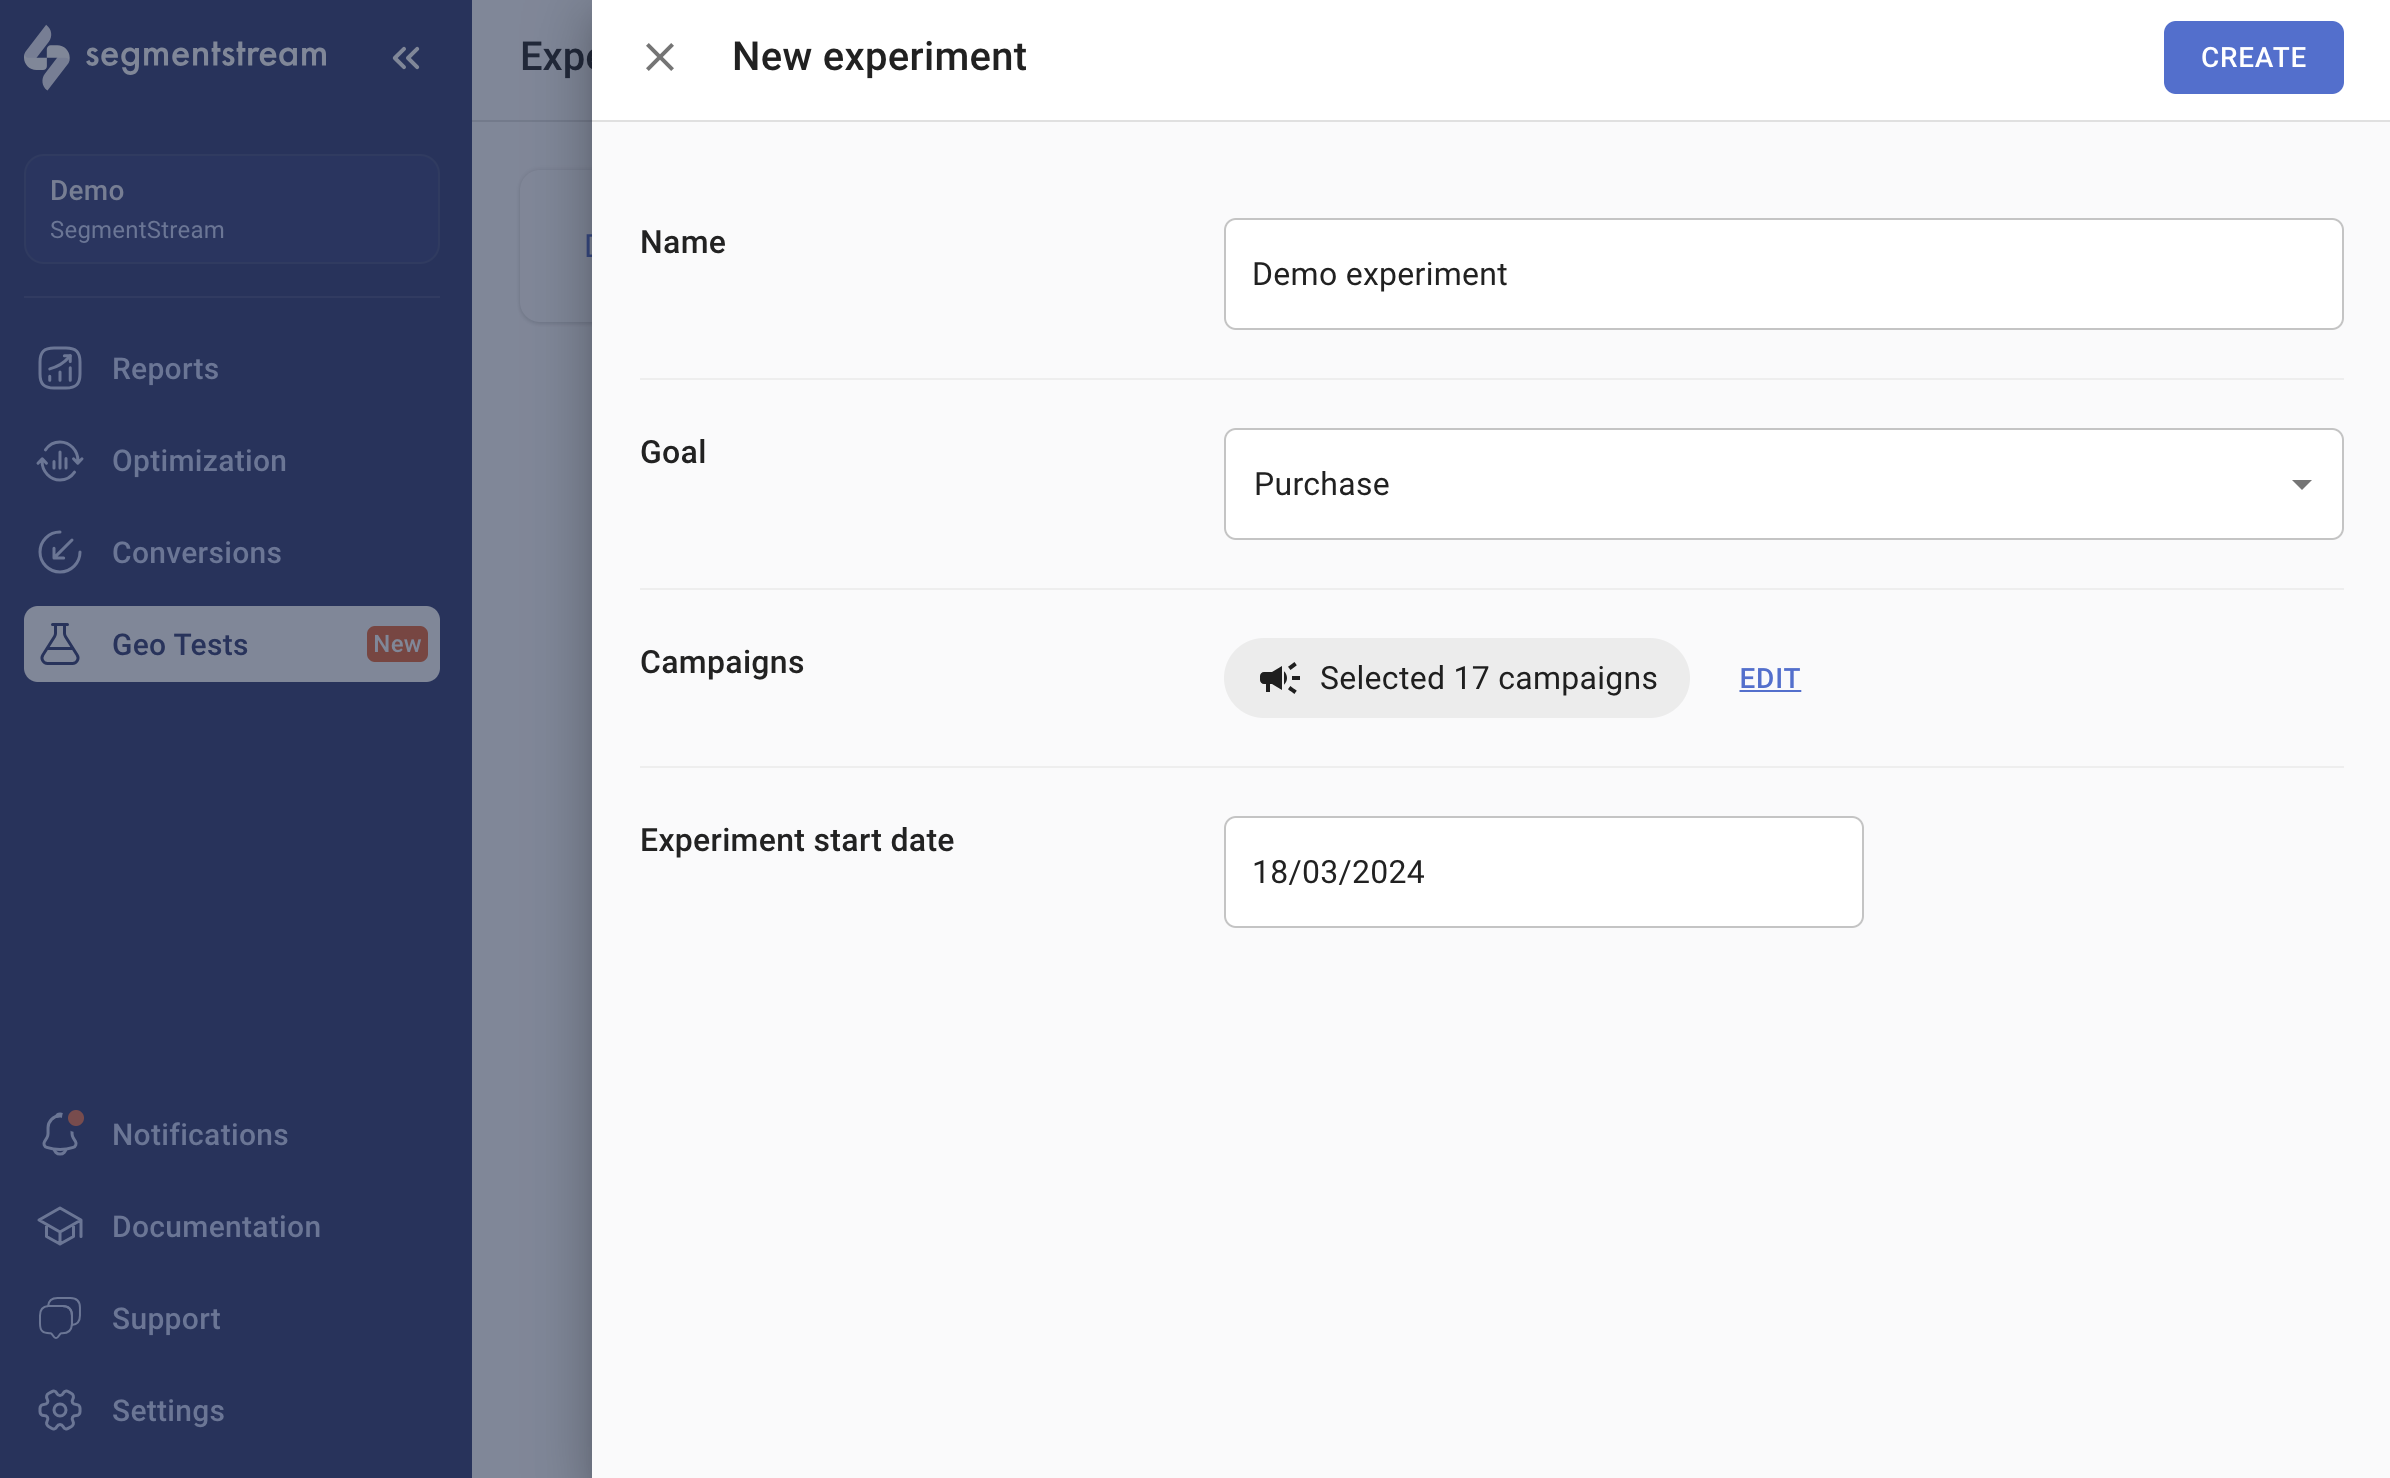 SegmentStream automatically selects the test and control markets, but you can adjust them if necessary.
 Pause the targeted marketing efforts within the designated test regions.
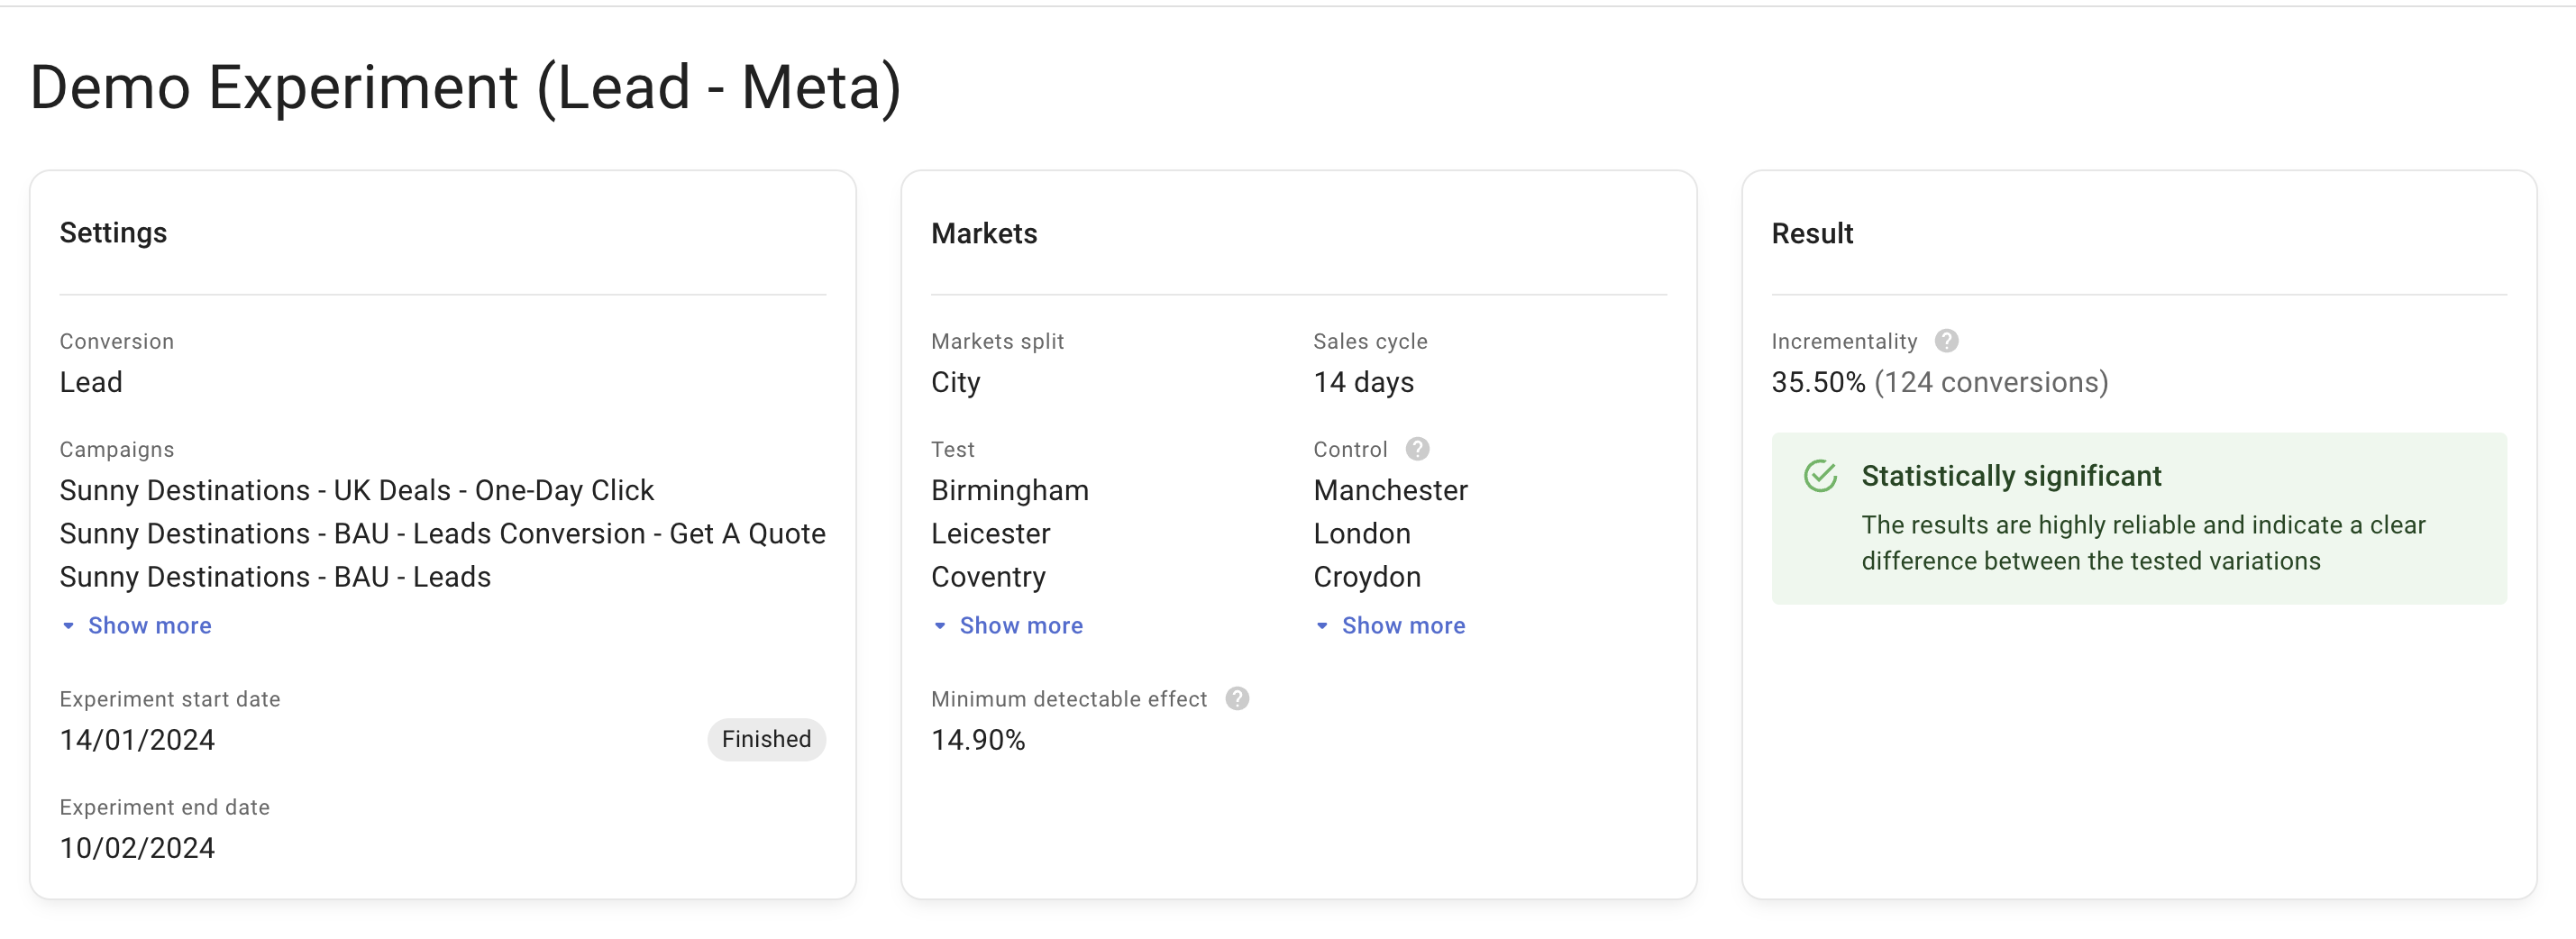
Review the experiment results to gain insights into campaign incrementality.
## Market selection
### Market split
Select the geographic level at which the test and control markets will be chosen. Default options include city, country, and region.
Default options rely on IP geolocation, which provides only approximate user locations. Using fine-grained geo splits such as "city" may significantly impact experiment results due to approximation inaccuracies.
To use more reliable geo data, SegmentStream provides the option to utilize CRM data by exporting it into BigQuery and creating a custom conversion that includes the geo data. The parameters from your custom conversions appear in the selector under the **Custom parameters** label.
For assistance in utilizing CRM data, contact your SegmentStream manager.
### Granularity
If there are not enough daily conversions to measure incrementality, select the **Weekly** granularity option. This affects both the sales cycle setting and how data is visualized in the conversion and cost charts.
### Sales cycle
Enter the typical duration for a user to achieve the set goal from their initial interaction with your brand. Understanding the sales cycle is essential as it determines the period over which the impact of a campaign should be evaluated.
### Test and control markets
The system analyzes trends, seasonality, and volume across various regions, choosing those with the highest correlation. A synthetic control approach is used to scale data from control regions to more closely align with the test regions' data.
### Exclude markets
You can exclude any markets that should not be included in the experiment. After selecting the excluded markets, the test and control markets are recalculated.
### Minimum detectable effect
The minimum detectable effect (MDE) is detected once the test and control markets are selected. MDE is the smallest change in results that an experiment can reliably detect. If the incrementality is lower than this number, it cannot confidently be attributed to the campaigns within the experiment.
When SegmentStream detects that the MDE exceeds a critical value, a warning is displayed indicating that the selected experiment configuration is not recommended.
## Results
Once your experiment is launched, the metrics reflecting its progress are displayed.
### Incrementality
This metric presents the calculated incrementality of the campaigns involved in the experiment, as well as the total conversion difference between the test and control markets.
### Experiment evaluation
Once the experiment is done, a banner informs you if the results are strong enough to make clear conclusions and whether it is suggested to run the experiment again.
Pause the targeted marketing efforts within the designated test regions.
Review the experiment results to gain insights into campaign incrementality.
## Market selection
### Market split
Select the geographic level at which the test and control markets will be chosen. Default options include city, country, and region.
Default options rely on IP geolocation, which provides only approximate user locations. Using fine-grained geo splits such as "city" may significantly impact experiment results due to approximation inaccuracies.
To use more reliable geo data, SegmentStream provides the option to utilize CRM data by exporting it into BigQuery and creating a custom conversion that includes the geo data. The parameters from your custom conversions appear in the selector under the **Custom parameters** label.
For assistance in utilizing CRM data, contact your SegmentStream manager.
### Granularity
If there are not enough daily conversions to measure incrementality, select the **Weekly** granularity option. This affects both the sales cycle setting and how data is visualized in the conversion and cost charts.
### Sales cycle
Enter the typical duration for a user to achieve the set goal from their initial interaction with your brand. Understanding the sales cycle is essential as it determines the period over which the impact of a campaign should be evaluated.
### Test and control markets
The system analyzes trends, seasonality, and volume across various regions, choosing those with the highest correlation. A synthetic control approach is used to scale data from control regions to more closely align with the test regions' data.
### Exclude markets
You can exclude any markets that should not be included in the experiment. After selecting the excluded markets, the test and control markets are recalculated.
### Minimum detectable effect
The minimum detectable effect (MDE) is detected once the test and control markets are selected. MDE is the smallest change in results that an experiment can reliably detect. If the incrementality is lower than this number, it cannot confidently be attributed to the campaigns within the experiment.
When SegmentStream detects that the MDE exceeds a critical value, a warning is displayed indicating that the selected experiment configuration is not recommended.
## Results
Once your experiment is launched, the metrics reflecting its progress are displayed.
### Incrementality
This metric presents the calculated incrementality of the campaigns involved in the experiment, as well as the total conversion difference between the test and control markets.
### Experiment evaluation
Once the experiment is done, a banner informs you if the results are strong enough to make clear conclusions and whether it is suggested to run the experiment again.
 ## Charts
### Conversion chart
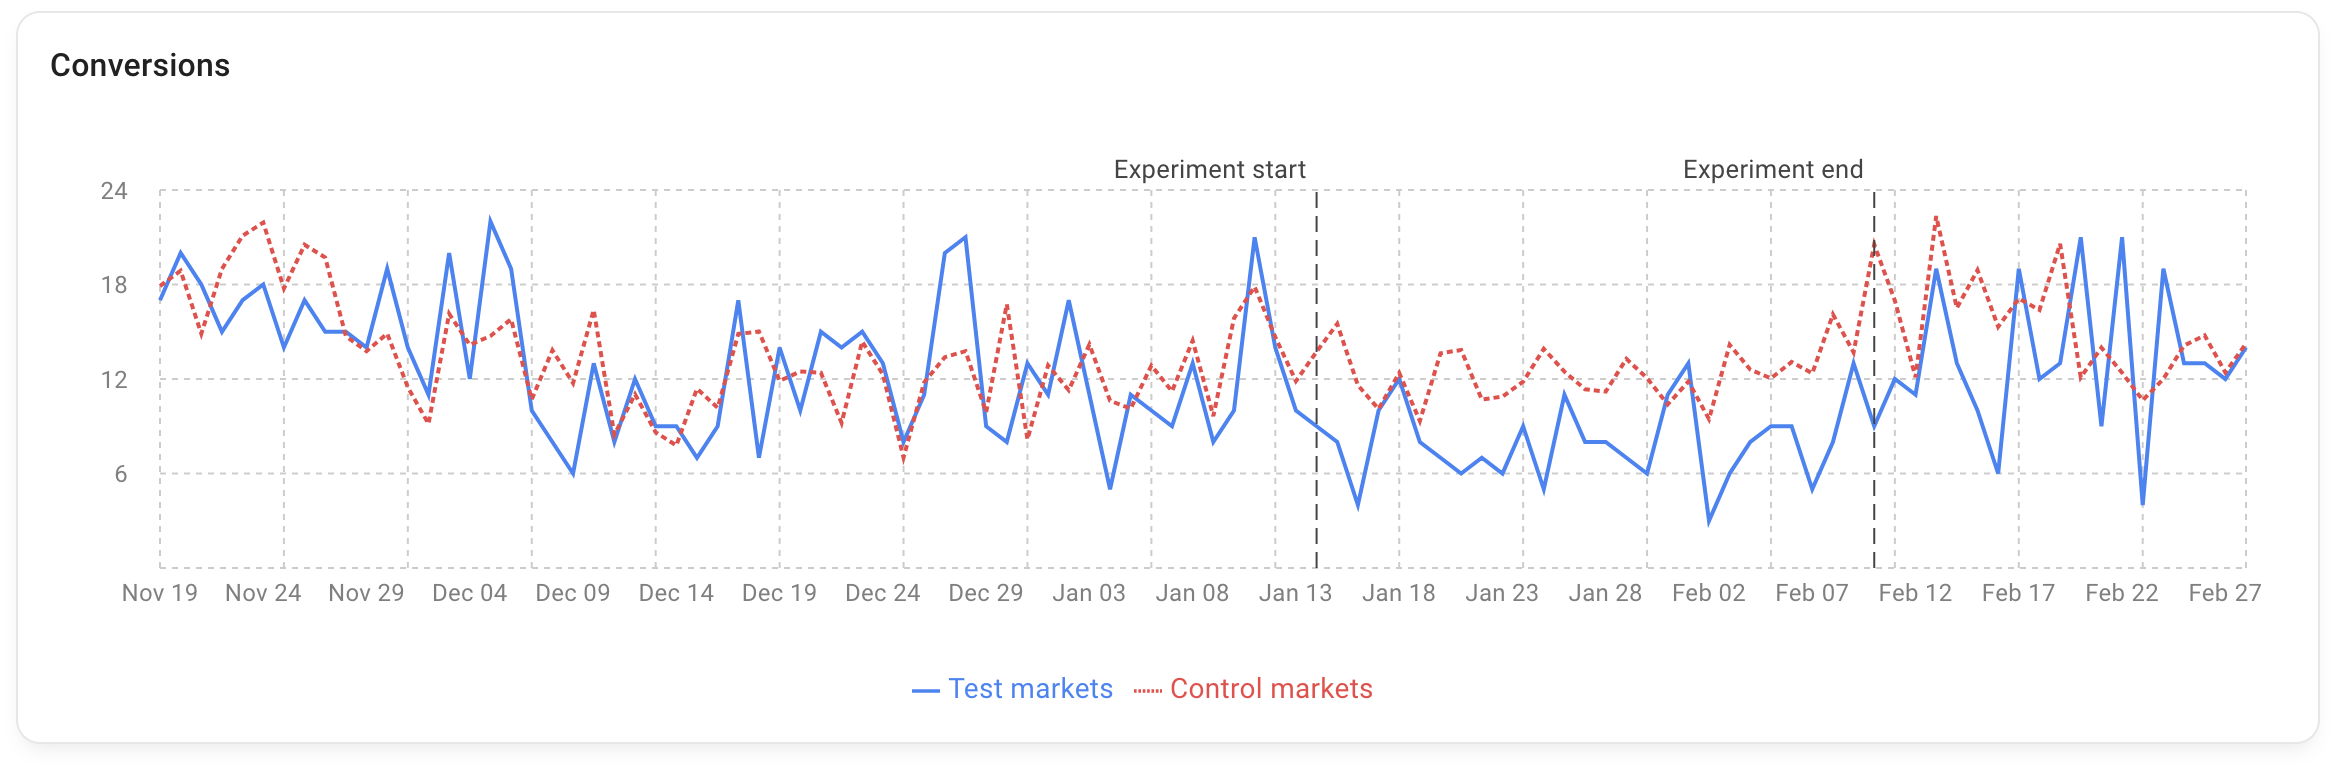
The conversion chart displays two lines representing conversion trends over time for both test and control markets, including the experiment's start and end dates.
Before the experiment starts, the algorithm selects test and control markets so that their lines closely align. Once the experiment begins, the blue line (test markets) is expected to drop below the red line (control markets), indicating the effectiveness of the campaigns included in the experiment.
## Charts
### Conversion chart
The conversion chart displays two lines representing conversion trends over time for both test and control markets, including the experiment's start and end dates.
Before the experiment starts, the algorithm selects test and control markets so that their lines closely align. Once the experiment begins, the blue line (test markets) is expected to drop below the red line (control markets), indicating the effectiveness of the campaigns included in the experiment.
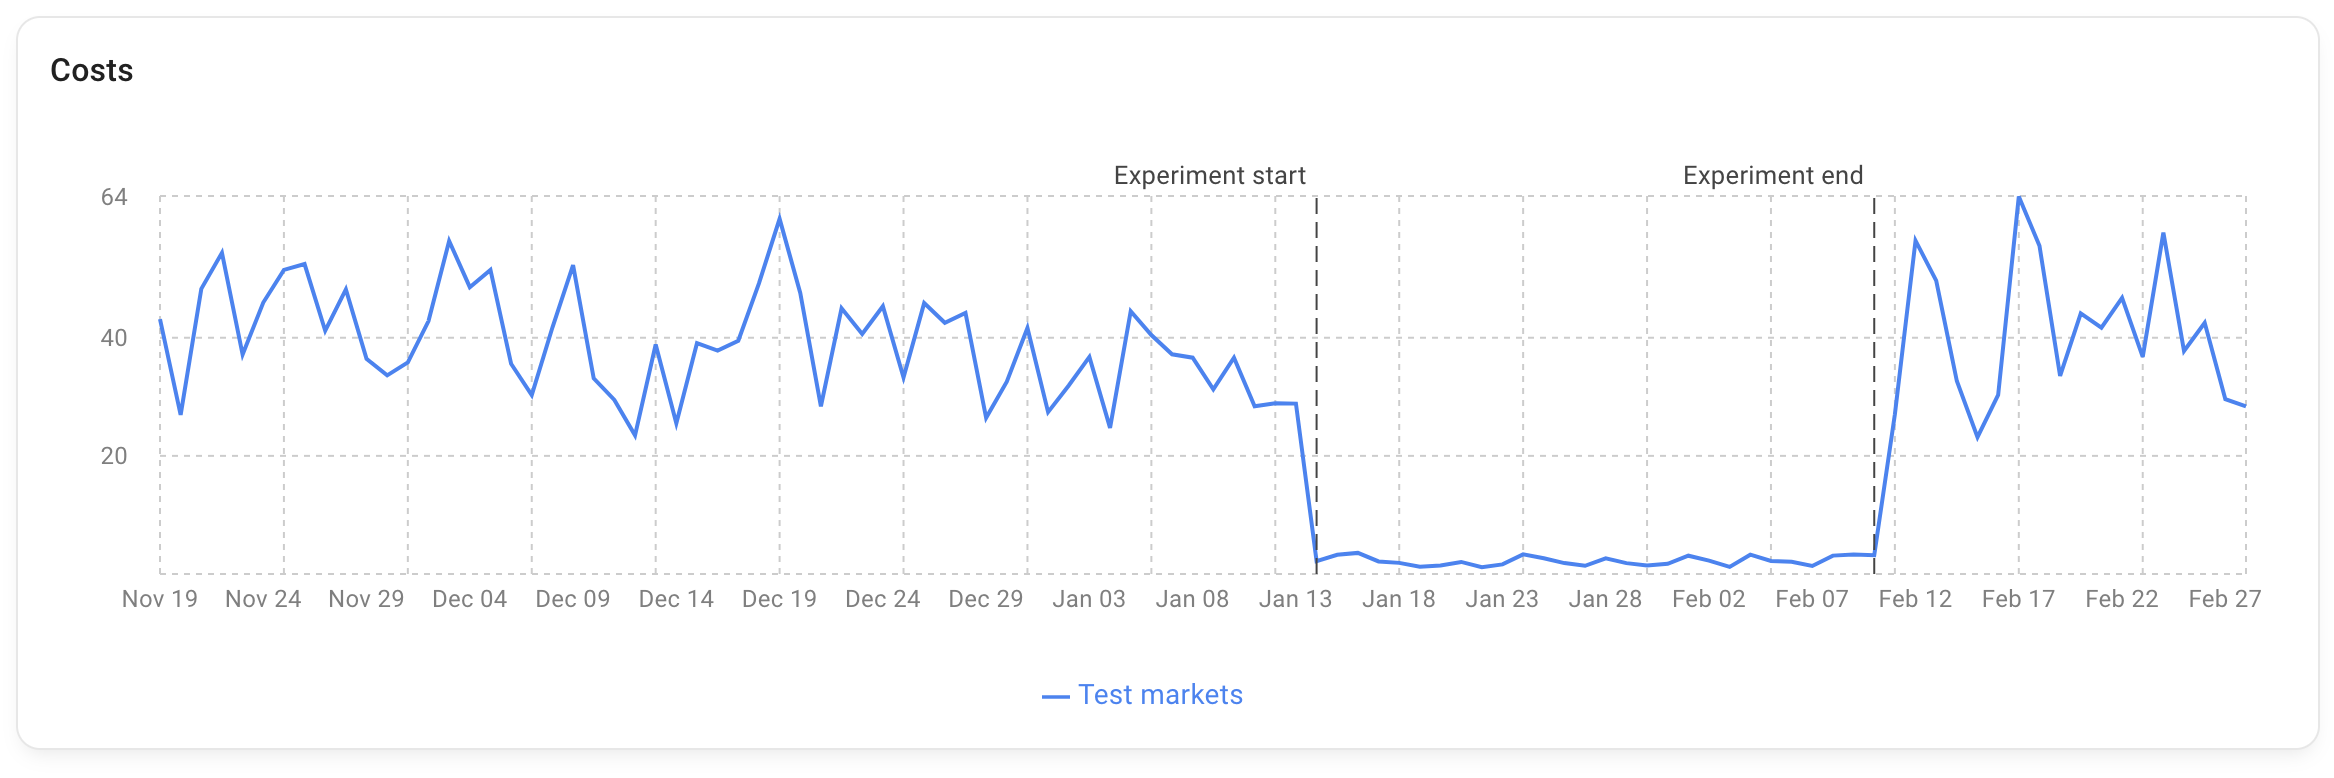
 ### Cost chart
The cost chart shows the trend in advertising expenditure over time for the chosen test markets. It enables you to verify that the treatment is applied correctly throughout the experiment -- indicated by the line remaining close to zero.
### Cost chart
The cost chart shows the trend in advertising expenditure over time for the chosen test markets. It enables you to verify that the treatment is applied correctly throughout the experiment -- indicated by the line remaining close to zero.