> ## Documentation Index
> Fetch the complete documentation index at: https://docs.segmentstream.com/llms.txt
> Use this file to discover all available pages before exploring further.
# Data filtering
> Filter attribution report data by date ranges and dimension values to focus on the metrics that matter.
SegmentStream lets you filter data in two ways: by date and by dimension values.
SegmentStream does not currently support filtering based on metric values.
## Filtering by date
To filter data in charts and tables by date:
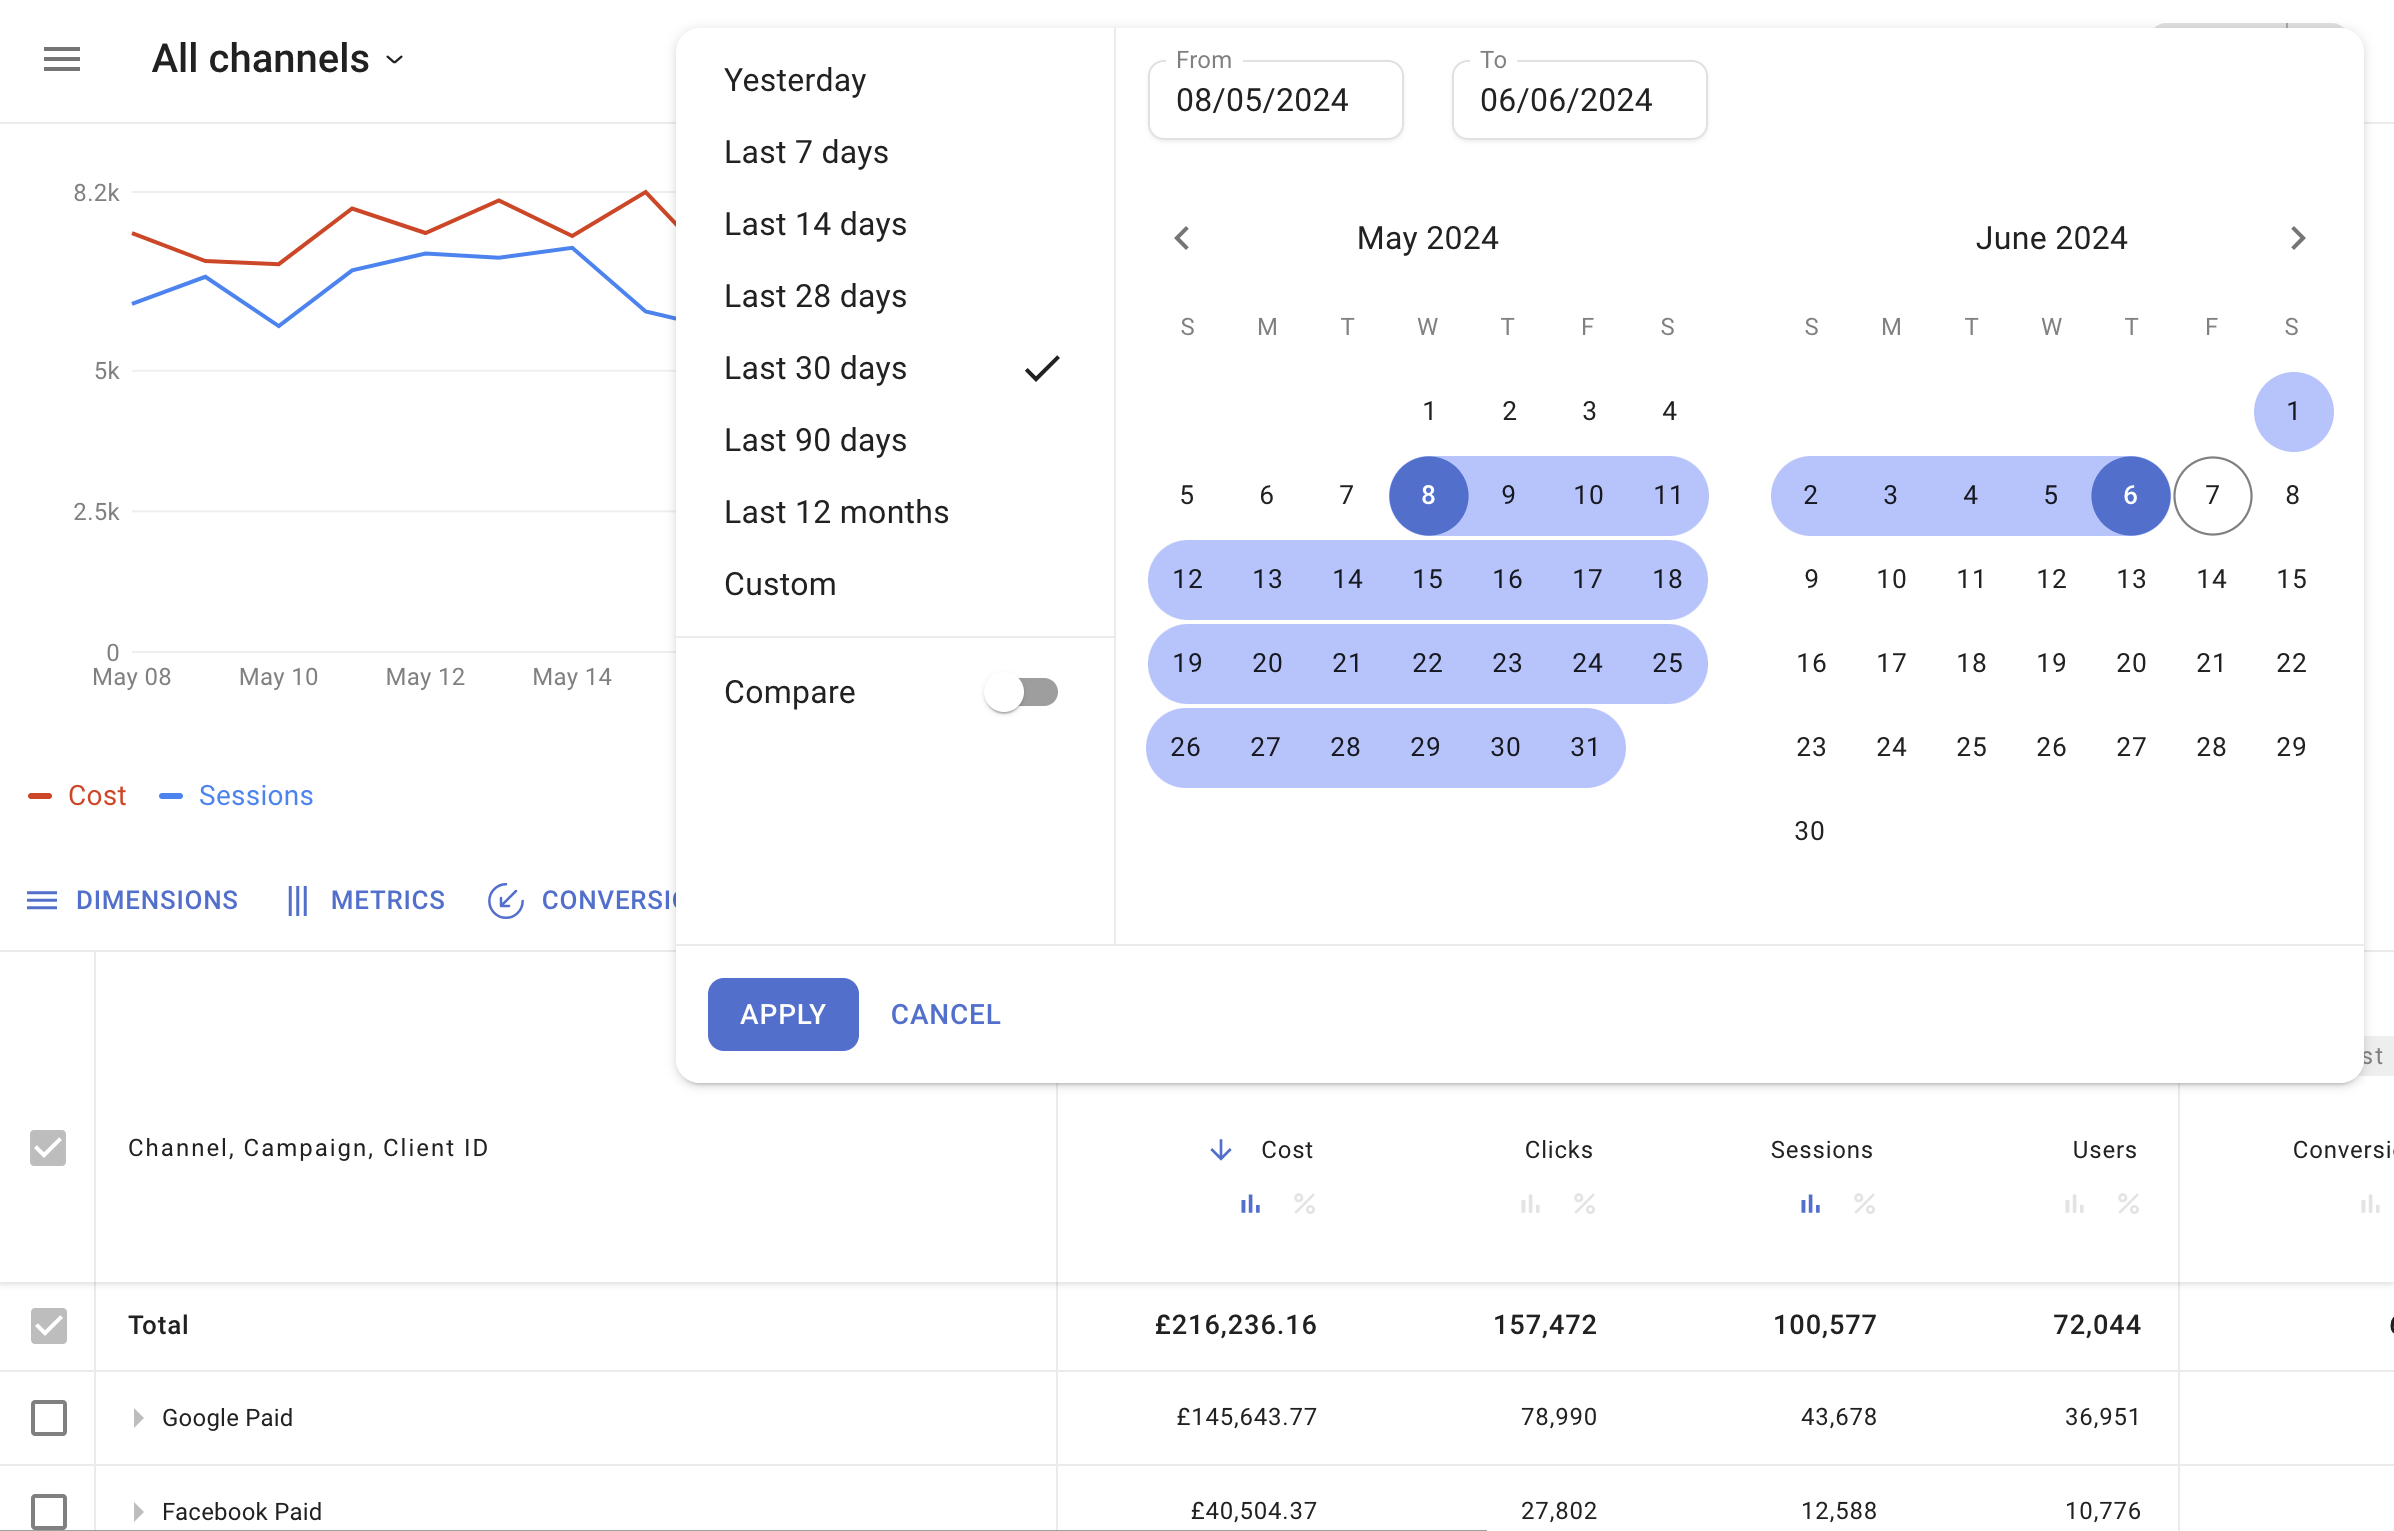
Click the calendar widget at the top left corner.
Choose from the predefined ranges:
* Yesterday
* Last 7 days
* Last 14 days
* Last 28 days
* Last 30 days
* Last 90 days
* Last 12 months
* Custom
The **Custom** option lets you define any specific time period using the calendar control.
 ### Comparing time periods
To compare metrics from different periods:
Click the **compare** option in the date filter dropdown.
Select from the available options:
* **Preceding period** -- automatically selects a period equal in length to the one you defined.
* **Preceding period (match day of week)** -- matches in length and starts on the same day of the week.
* **Same period last year** -- a year-over-year comparison.
* **Same period last year (match day of week)** -- year-over-year comparison aligned by day of the week.
* **Custom** -- define your own preceding period using the input fields at the top of the date filter dropdown.
When comparison mode is enabled, each metric table cell displays:
* The value for the current period at the top.
* The value from the compared period at the bottom.
* The calculated difference between the two values.
Charts do not support comparison mode. Charts display data only for the selected current period.
## Filtering by dimension values
To filter data in charts and tables based on dimension values:
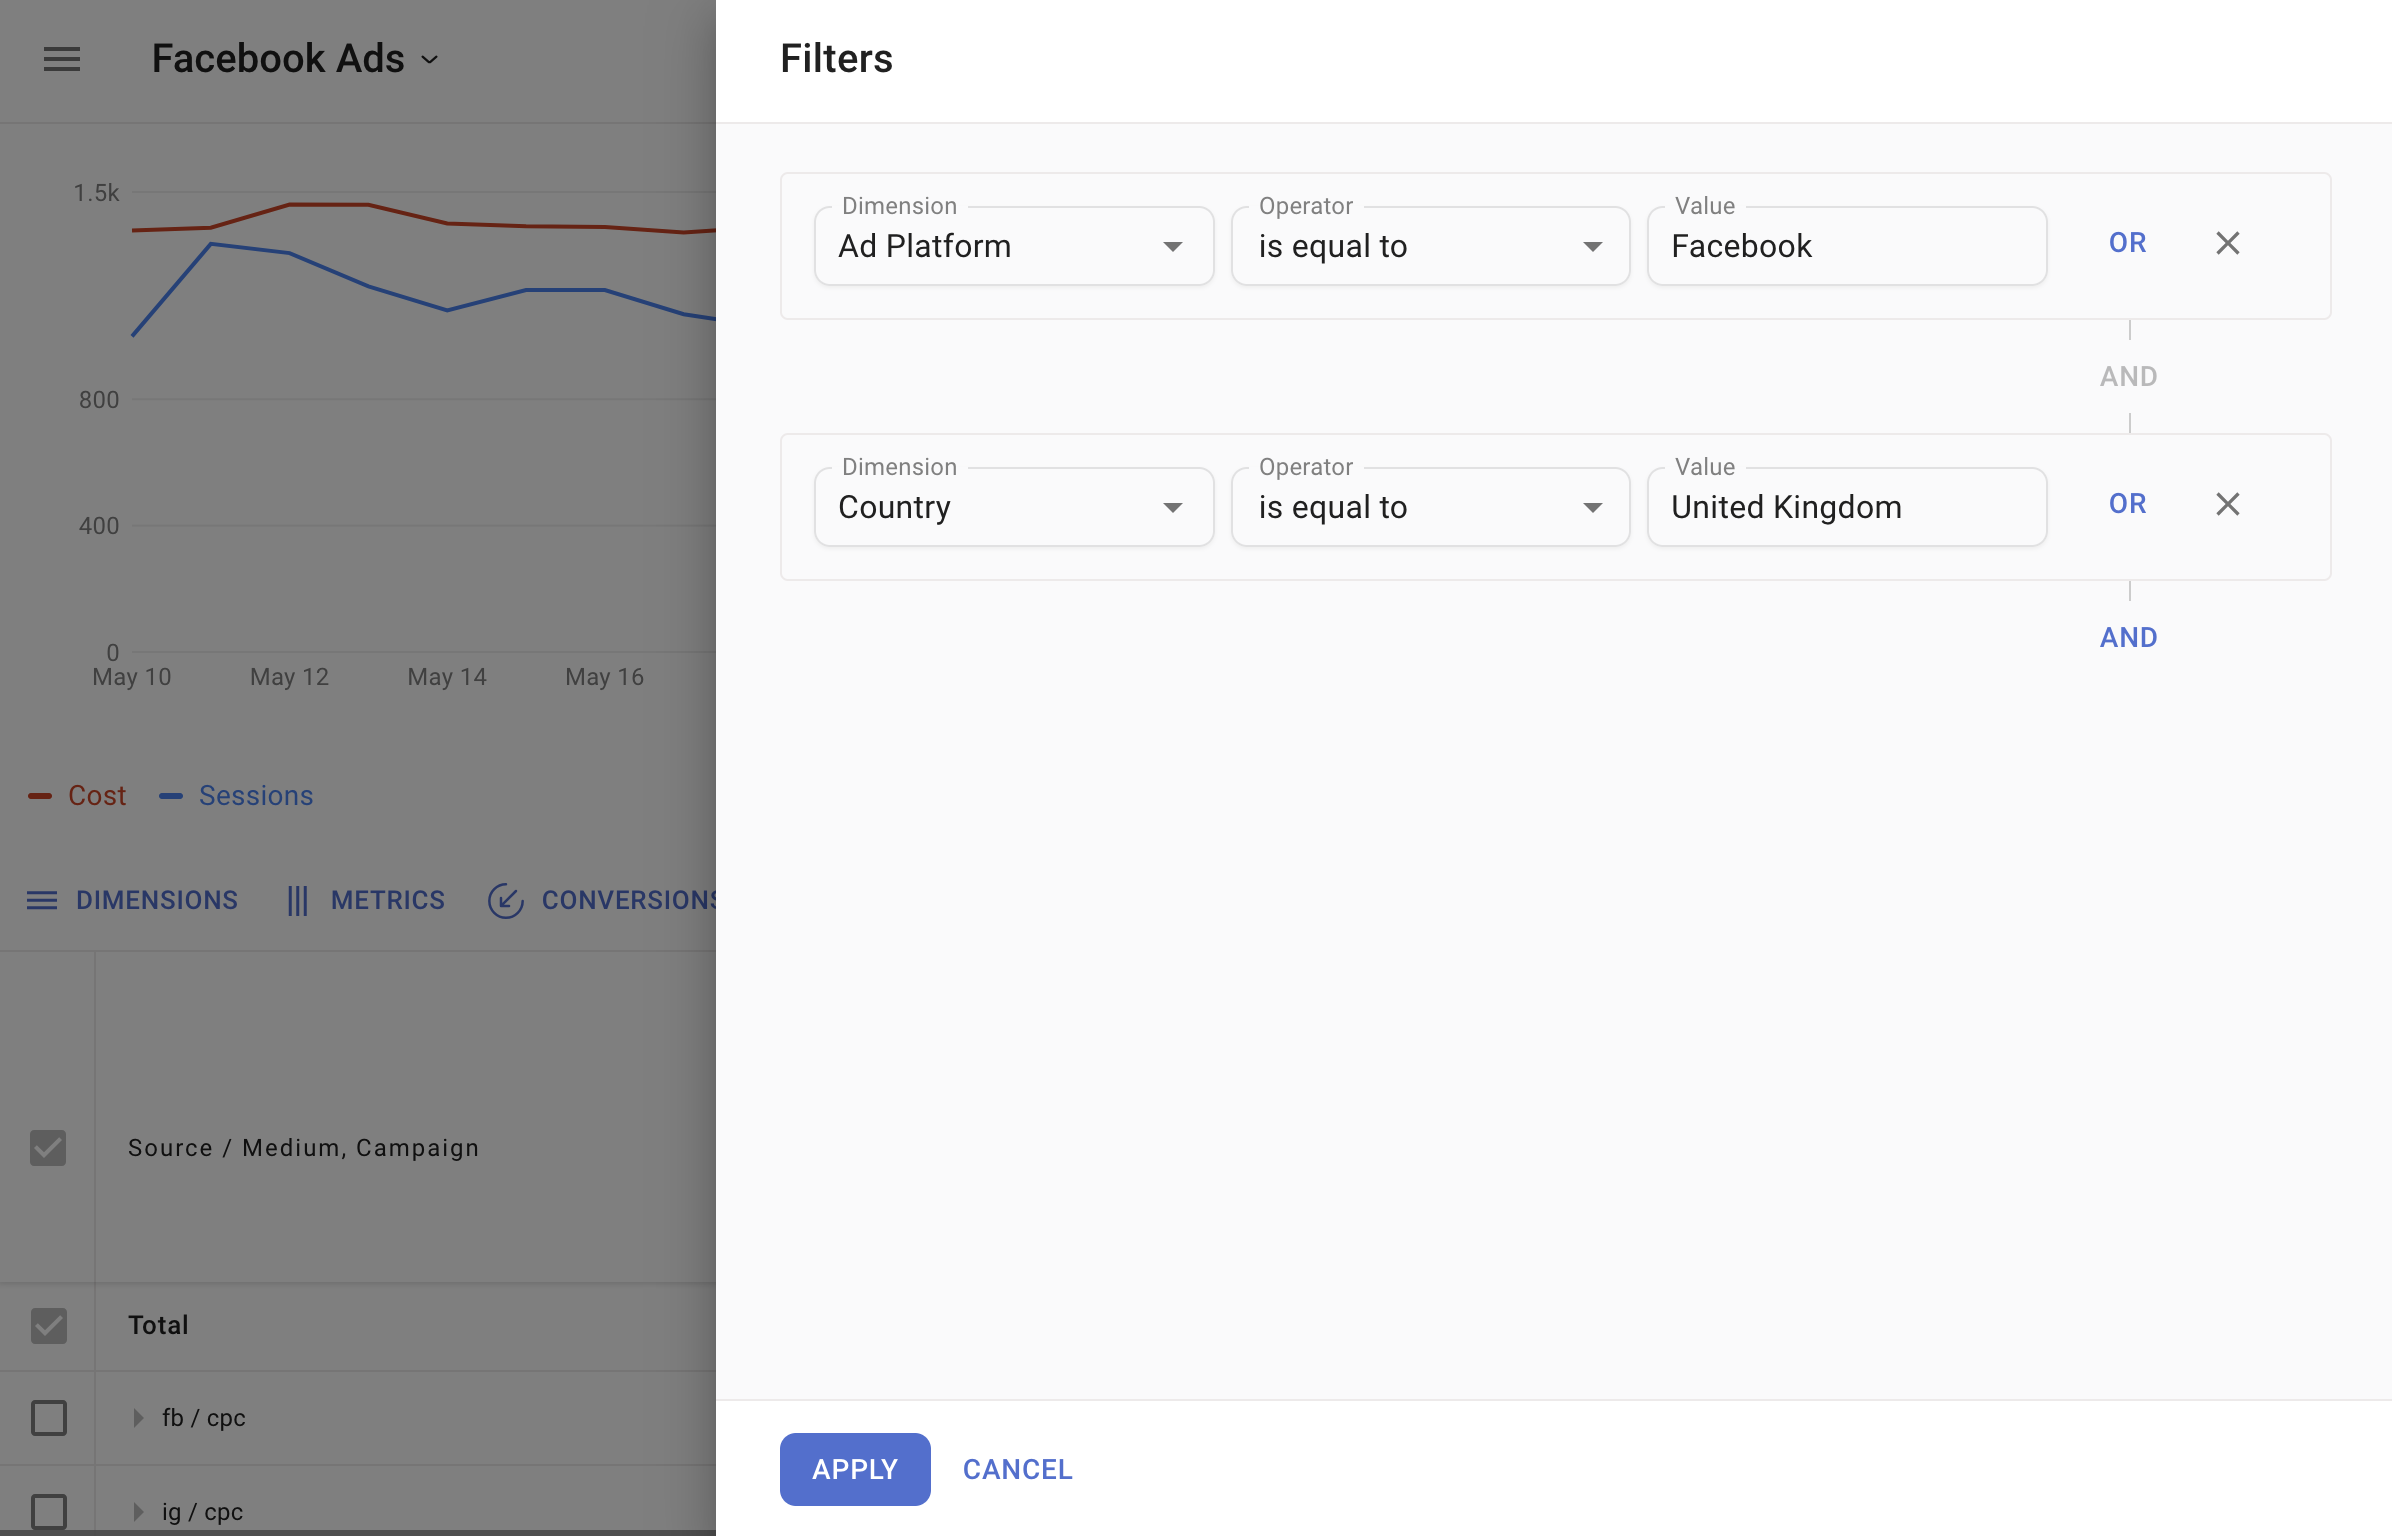
Below the chart, click the **Filters not set** button. This displays a window for configuring advanced filters.
Each filter row represents a rule. For example, to view data only for visitors from the UK:
* Select dimension: `Country`
* Choose operator: `is equal to`
* Pick the value for the UK from the dropdown list.
Click the **Apply** button.
You can create multiple rules and connect them using **AND** or **OR** logic.
Examples:
* Display results where `Ad platform is equal to Facebook Ads` AND `Country is equal to United Kingdom`
* Display data where `Country is equal to United Kingdom` OR `Country is equal to US`
* View campaigns with "ES" in their name using `Campaign contains ES`
### Comparing time periods
To compare metrics from different periods:
Click the **compare** option in the date filter dropdown.
Select from the available options:
* **Preceding period** -- automatically selects a period equal in length to the one you defined.
* **Preceding period (match day of week)** -- matches in length and starts on the same day of the week.
* **Same period last year** -- a year-over-year comparison.
* **Same period last year (match day of week)** -- year-over-year comparison aligned by day of the week.
* **Custom** -- define your own preceding period using the input fields at the top of the date filter dropdown.
When comparison mode is enabled, each metric table cell displays:
* The value for the current period at the top.
* The value from the compared period at the bottom.
* The calculated difference between the two values.
Charts do not support comparison mode. Charts display data only for the selected current period.
## Filtering by dimension values
To filter data in charts and tables based on dimension values:
Below the chart, click the **Filters not set** button. This displays a window for configuring advanced filters.
Each filter row represents a rule. For example, to view data only for visitors from the UK:
* Select dimension: `Country`
* Choose operator: `is equal to`
* Pick the value for the UK from the dropdown list.
Click the **Apply** button.
You can create multiple rules and connect them using **AND** or **OR** logic.
Examples:
* Display results where `Ad platform is equal to Facebook Ads` AND `Country is equal to United Kingdom`
* Display data where `Country is equal to United Kingdom` OR `Country is equal to US`
* View campaigns with "ES" in their name using `Campaign contains ES`